
Forum Replies Created
-
AuthorPosts
-
 AgamemnonParticipant
I thought I had that figured out. But, maybe not.
Breaking down Nick Foles’ $26.068 million extension
Posted August 12, 2015 ·St. Louis Rams quarterback Nick Foles’ two-year contract extension is worth $26.068 million and includes a $3 million signing bonus, according to a source with knowledge of Foles’ deal.
Foles got $13.792 million guaranteed.
In 2015, he’s due a fully guaranteed $1.042 million base salary and has $6.068 million in total compensation with a $4.068 million salary-cap figure.
The deal has no offset language in the first year.
Foles gets a $2 million roster bonus on Sept. 1. That’s guaranteed for skill and injury at signing, guaranteed for salary cap if on the roster on Aug. 15.
Foles has an annual $4.5 million in not likely to be earned incentives based on Pro Bowl; p/t + wins or playoffs or playoff wins; p/t + wins or playoffs or playoff wins and Club/player rankings.
Foles has workout bonuses of $6,240 and $20,000 in 2015.
In 2016, he has a $.175 million base salary and a $8.75 million salary-cap figure. The salary is guaranteed for injury at signing and skill and cap if on the roster the fifth day of the 2016 league year and includes offset language.He’s due a $6 million roster bonus on the third day of the 2016 league year, guaranteed for skill and injury at signing, guaranteed for cap if on the roster on Aug. 15, 2016 and has no offset language.
In 2017, he has a $13.25 million salary cap figure and a $10.75 million nonguaranteed base salary.
He has a $1.5 million roster bonus due on the third day of the 2017 league year.
Finally found the exact Foles contract. The offset language, for his salary this year, is the key. This means that like Finnegan, the Rams can get some or all of his salary back, even if they cut him. A trade takes them off the hook. The other team honors Foles’ contract.There is still $1 million of the $3 million signing bonus left on the books. The best the Rams can do is gain $.75 million and that might not come this year. If he is cut, the offset kicks in next year.
It appears the $1 million of the $3 million signing bonus doesn’t have to be booked this year. The Rams can wait until next year if they want. See below.
 AgamemnonAgamemnonParticipant
Andrew Brandt reacts to Andrew Luck’s new contract.
He says the same thing I said in previous posts. The way to look at things in is new money, new years.
Brandt talks about Baldwin’s contract and Seattle at about the 21 minute mark. The power of drafting well.
AgamemnonJuly 1, 2016 at 10:51 am in reply to: How Doug Baldwin's contract extension could impact Tavon Austin #47606AgamemnonParticipantI can name the players I would keep.
On offense: Goff at 13 % [franchise money]
I am not paying Robinson premium money, I will replace him with Williams or Battle.
Gurley at 7.6 % [franchise money]
Austin at 7.4 %, I have to keep my playmakers. [WR franchise money is 9.4%]
.
On defense. Donald at 10.1 % [best player on defense money]
Quinn at 10.1 % [franchise money]
that is it. I have a QB and 4 unique talents. I am not worried about the rest. They will fit in somewhere. Next year, I only need to find $6-8 million dollars to keep everybody. imo
So, I have 5 guys at 48 % of the cap.
.
Goff is still a question mark for me.
I am not paying Austin franchise WR money.
I hope Quinn is healthy.
In order: Donald, Gurley, Goff, Quinn, Austin.-
This reply was modified 9 years, 8 months ago by
 Agamemnon.
-
This reply was modified 9 years, 8 months ago by Agamemnon.
-
This reply was modified 9 years, 8 months ago by Agamemnon.
AgamemnonJuly 1, 2016 at 10:42 am in reply to: How Doug Baldwin's contract extension could impact Tavon Austin #47605AgamemnonParticipantzn and I do stuff differently, but it usually ends up in the same time zone. 😉
I think the maximum number of players you can squeeze into the Cap is 10 players for 60% of the cap.
The dollar amounts change year by year. The percents stay the same.
2016 – $155.27 x 60% = 93.2 million
2017 – $166 x 60% = 99.6 million
2018 – $178 x 60% = 106.8 million
2019 – $190 x 60% = 114 million
2020 – $200 x 60% = 120 million
AgamemnonJuly 1, 2016 at 10:30 am in reply to: How Doug Baldwin's contract extension could impact Tavon Austin #47603AgamemnonParticipantDoug Baldwin signed a 4 year, $46,000,000 contract with the Seattle Seahawks, years 2017-2020. salary = 11.5m/yr Cap ave = 183.5M Baldwin equals 6.3% of the cap.
Harvin got 5 years for 64.225M, 2014-2018. salary = 12.84m/yr Cap ave = 155.5M Harvin equals 8.3% of the cap.
Randall Cobb signed a 4 year, $40,000,000 contract with the Green Bay Packers, years 2015-2018. salary = 10m/yr Cap ave = 161.1M Cobb equals 6.1% of the cap.
a franchise WR gets 9.4% of the cap
Austin’s 5th year option is 12.268m in 2017. the Cap will be ~166M in 2017 Austin gets 7.4% of the cap
Givin all that 7.4% of the cap might be ok. imo AgamemnonJuly 1, 2016 at 9:59 am in reply to: How the Seahawks revolutionary cap management transformed the le #47598AgamemnonParticipant
2016 Seahawks
1 player takes 12%
2 players take 22%
5 players take 40%
10 players take 60%
24 players take 77%
53 players take 89%
Seattle extremis. This is after Baldwin got a new contract. AgamemnonAgamemnonParticipant
I thought Clayton did a good job on how the guarantees worked. AgamemnonAgamemnonParticipant
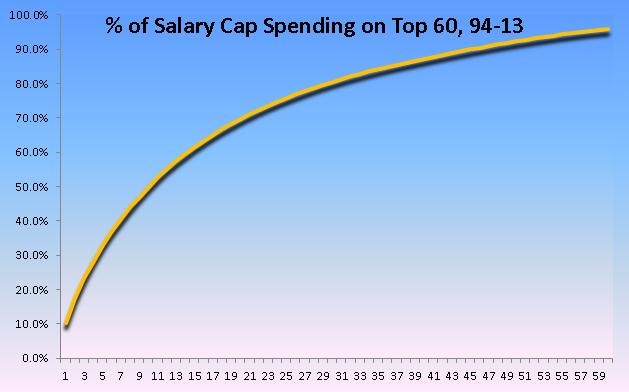
2013 Seahawks, plotted against an average of super bowl teams.
1 player takes 8%
3 players take 22%
5 players take 34%
10 players take 55%
28 players take 76%Seattle is not that far of the curve at any point. Seattle’s curve might not look like the curve of another team. That team might be over or under the curve at different points. Most teams will probably fit the curve though. imo There is less real difference between how teams distribute their cap dollars than it appears, at least on how close they fit the curve. imo
It is more about value. What value can you get for your cap money. A cheap QB is really big. Having a lot of young talented players is good, if it is before they get their second contract. Having players that out perform their contracts is good. Think Hayes, Donald, Gurley for the Rams. imo
AgamemnonAgamemnonParticipantForget the way the guy did his calculations. He is comparing Rogers 5 year money to Lucks 6 year money. He then uses the date they signed to make a comparison. Aaron Rodgers signed a 5 year, $110,000,000 contract with the Green Bay Packers, Andrew Luck signed a 5 year, $122,970,000 contract with the Indianapolis Colts.
Rogers is 22M/yr. Luck is 24.6M/yr. If you then take the yearly figure for each player, over the new years of their contracts, They both are getting 13.2% of the cap.
He is right about the contract really isn’t out of whack and that Luck might have been able to get more. But isn’t as big a deal as he makes out and he uses with faulty logic/math to try to make a point. imo
As you can see above, The percentage paid to franchise QBs has increased over the years. I was only able to go back to 2008. I steadily goes up until the new CBA. They then changed the way they calculate the franchise number. Instead of an average of the 5 highest salaries. They go back over 5 years to get that average. That makes it drop a bit. But it is now trending up. I suspected that. It isn’t a big deal, unless QBs go over 14.2% of the cap. imo
-
This reply was modified 9 years, 8 months ago by Agamemnon.
AgamemnonAgamemnonParticipant AgamemnonAgamemnonParticipant
We can use the graph this way, take your 4 best players. 4 players that you really really want to keep. They probably should not take up more than 34% of your cap space. Although, it would be Ok, if they took up to ?40% of your cap. You would just need to realize that what you put into your 4 best players has to come from some other place in your roster and weigh if it is best keep your 4 players or what is the best way to shape your roster.
AgamemnonAgamemnonParticipantA review of Andrew Luck's contract shows $47 million guaranteed at time of signing, $60 million guaranteed by start of 2017 league year.
— Adam Schefter (@AdamSchefter) June 29, 2016
AgamemnonAgamemnonParticipant
Above he as figures of 9% for 1 player, 22% for 3 players, and 32% for 5 players on superbowl teams between 1994 – 2013.
I did it in 2016 for 5 regular playoff teams and got 18% for 2 players and 30% for 4 players. 12 – 14 players equals 53 – 60%. Both groups all hit the curve in the graph.
His super bowl teams, when he counted the top 10 players, never used up more than 56% of the cap. The average was ~50%.
Since everything fits the curve above, I will take that to be the optimum model. It is derived from teams in the super bowl.

2 players at 24% and 6 players at 50%. According to my theory, 2 at 24% is Ok. 6 at 50% is not Ok. Well, it could be Ok. It might even be better than OK. But it is not an ideal fit. These are averages and how well did each super bowl team fit the average?
AgamemnonAgamemnonParticipanthttp://overthecap.com/nfl-salary-cap-super-bowl-champions-part-ii/
The NFL Salary Cap and Super Bowl Champions Part II
Posted on August 26, 2014 by Jason FitzgeraldIn Part I of our look back at the salary cap spending of Super Bowl Champions we looked at spending on the top spots of the roster. In this one we want to look at the positional breakdowns of those top roster spots on the champions. Just as a quick reminder we are not including the 97 and 98 Broncos due to salary cap violations nor the 2010 Packers since the 2010 season had no salary cap. All figures are based on percent of the teams adjusted salary cap to adjust for the differences in salaries over the large time period.
Top Player Breakdown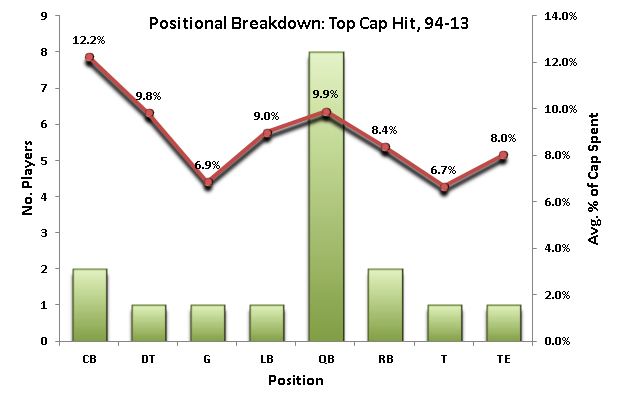
I’m sure it comes as no surprise that quarterback dominates the top salaried player on the team as 8 of 17 champions have spent the most money on the QB. I would have expected to see a few more pass rushers on the list, but only Terrell Suggs was the top salary cap player on his team. The highest average spending came on cornerbacks, but those were both the huge numbers spent on Ty Law by the Patriots. The two strange ones were Guard and Tight End. The high priced Guard was Alan Faneca on the lower spending Steelers team and he would not have been anywhere near the top of almost any other team except the 2000 Ravens. Zach Miller took the top spot on the Seahawks, whose roster construction was very different than almost anyone else of the Super Bowl era.
Top Three Breakdown
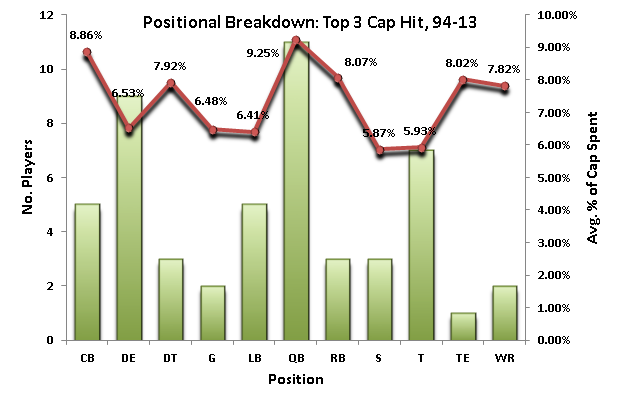
We move up to 11 QB’s once we expand to the top 3 cap charges on a team and now we get more of those pass rushers that I thought would be in the top spot. Offensive tackle also makes a big leap, which I think would be expected since teams with a high priced QB should be paying big money to protect his blindside. Five of the seven tackles who made the top three also had a QB in the top 3 in salary. Those teams were the 1994 49ers, 2006 Colts, 2007 Giants, and 2008 Steelers .
Top 5 Breakdown
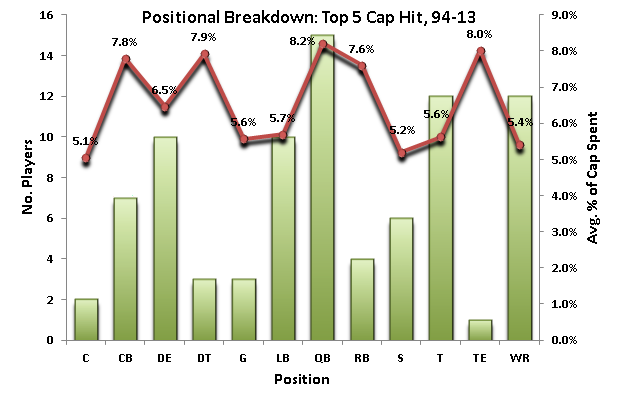
Once we extend to 5 teams we have almost every position represented (punter and kicker are missing). 15 out of 17 teams had the QB as one of the top 5 paid players on the team which is basically telling everyone that you won’t win without a reasonably compensated QB. Wide Receiver, which was almost non-existent in the top of the roster cap charges sees a massive jump to 12 players. So while teams may move away from paying them the biggest money they are certainly not shy from paying them big money. Another interesting takeaway here was the lack of running backs. Though the league was not considered a “passing league” until the last 6 or 7 years, the runners on the SB champs have not been big money earners. The 4 runners that make the list are split between the 90s era and the more pass happy era.
Top 10 Breakdown
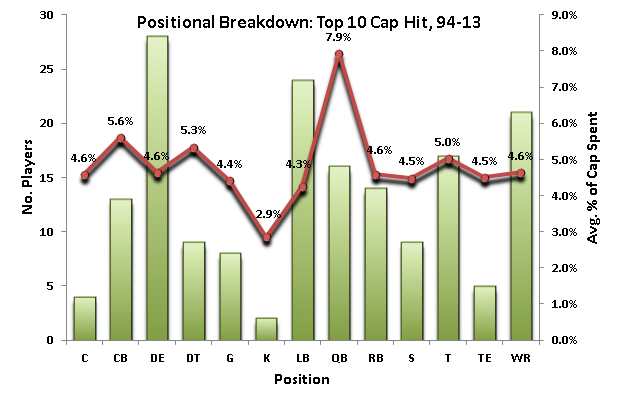
QB drops out of the top spot since there is only one spot available per team, but does remain the highest compensated. The only team that did not have a top 10 paid QB win the Super Bowl was the Seattle Seahawks in 2013. The most popular positions are the Defensive End and Linebacker positions. Some of those linebackers are pass rushers, so I think its sf to say most teams want to wind up with a strong pass rush. In fact every team had at least one “pass rusher” make the top 10 salaries on the roster.
Five teams did not have a top 10 paid cornerback on the team. Those teams were the 1996 Packers, 2005 Steelers, 2006 Colts, 2008 Steelers and 2013 Seahawks. Only five teams did not have a high priced running back on the roster, all of whom won before 2008. The teams were the 1994 49ers, 2001 Patriots, 2004 Patriots, 2006 Colts, and 2007 Giants. Only four teams failed to have a high cap tackle on the payroll- the 1996 Packers, 2002 Buccaneers, 2004 Patriots, and 2012 Ravens. Just two squads did not have a top 10 paid WR. Those teams were the 2000 Ravens and the 2011 Giants.
Positions on the lower end of the salary scale did not make many appearances on the list with multiple teams passing on spending much space on centers, defensive tackles, guards, tight ends, safeties and special teamers. In general these are all the lowest salaried positions in todays NFL, though safety is becoming more and more valuable.
Offensive/Defensive Breakdown
Overall there is a pretty even split between offensive and defensive positons making up the top 10. 83 of 170 positions were defensive players and 85 were offensive players, but teams skew towards offense first and defense second. 13 offensive players are the top cap hit for a Super Bowl champ to just 4 defensive players. When we look at the top three it balances out to 26/25. When we get to the top 5, though, again we get the heavy offensive investment- 49 offensive players to 36 defensive players- before it balances out again when we look at the top 10.
The Most Non-Traditional Teams
Seattle was the only team without a top priced QB, had a top 5 paid running back and tight end, and had a top 10 defensive tackle and center. There were no cornerbacks or linebacker in their top 10. All things considered that was probably the most non-traditional built team from a salary cap perspective of all time. A very unique team that will be very hard to duplicate.
The 2006 Indianapolis Colts spent the most on offensive talent with 7 of their top 10 cap positions being held by offensive players. The opposite end of the spectrum was the 2004 Patriots with just two offensive players in the top 10. They had 7 defensive players and a kicker to round out the list.
AgamemnonAgamemnonParticipanthttp://overthecap.com/nfl-salary-cap-super-bowl-champions-part/
The NFL Salary Cap and Super Bowl Champions, Part I
Posted on August 18, 2014 by Jason FitzgeraldSalary cap research, at least outside of an NFL organization, is pretty much an empty field. It’s understandable as salary cap numbers were always something that would be briefly mentioned in an article about a team and were not exactly public knowledge. There were more resources when various salary cap sites doing their best to track their favorite teams began springing up. I believe Miguel’s Patscap.com was the first site. Ian Whetstone, who contributes to OTC from time to time, kept (and still keeps) these great word docs and spreadsheets detailing salary cap reports from various sources. And with sites such as OTC now there is more ability to do research on current trends. But historical data is still a tough subject to come by.
For this series of posts I wanted to get together as much accurate historical data as I could and start looking at just how Super Bowl champions spend their salary cap dollars in building a championship team. So for this series we will go all the way back to 1994 and look at how each Super Bowl team was built. My focus is on top of the roster spending because that is the area that eats up essentially half a teams’ budget and is what we discuss the most on the site.
In part 1, which is today’s entry, we are going to look at the percentage of adjusted salary cap spent on the top player, top 3 players, top 5 players, and top 10 players on a roster. In part 2 we will look at the positional allocations among the teams. Finally in part 3 we’ll take a look at these trends and apply them to today’s NFL and see which teams most closely resemble the salary cap construction of Super Bowl champions.
There are a few things to keep in mind about the numbers. One is that the 2010 Green Bay Packers are not included because the year had no salary cap and thus there is no basis to rate their salary cap spending. The second is that, when discussing the spending I will be eliminating the 1997 and 1998 Denver Broncos from the discussion. I’ll include a separate section to explain that later in this post..
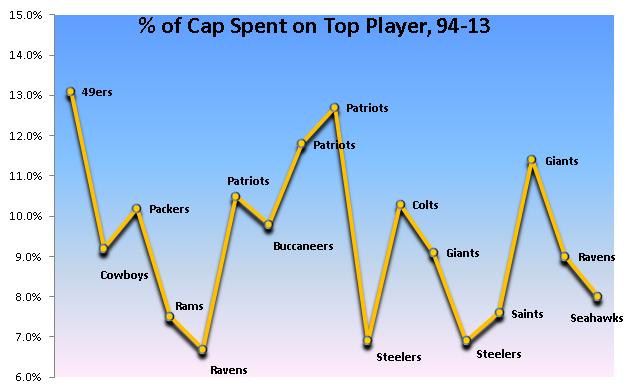
Top Player Salary Cap Spending
Average Spend: 9.5%
Largest Spender: 13.1% (Steve Young- 1994 49ers)
Lowest Spender: 6.7% (Jon Ogden- 2000 Ravens)
Just 7 of the 17 Super Bowl Champions of the salary cap era spent more than 10% of their entire salary cap on their highest priced player, with four of those teams coming between the 2001 and 2006 seasons (all three Patriots champions and the 2006 Colts). In general the trend has been towards less spending in recent years with 6 of the lowest spenders having come post 2005. I would tend to think that this could be due to teams putting more of an emphasis on drafting than veteran free agent starters, though it could also be teams being more effective for one year manipulation of the salary cap.
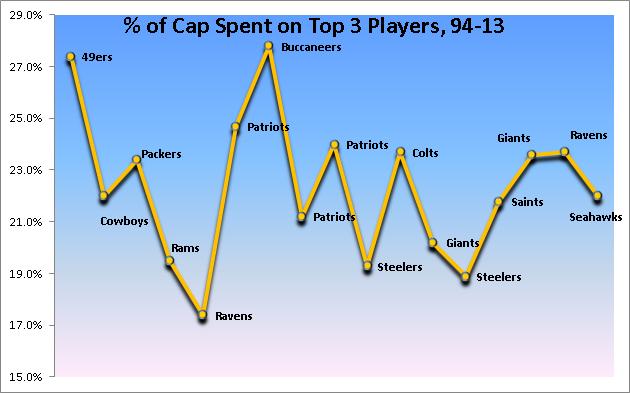
Top 3 Salary Cap Spending
Average Spend: 22.4%
Largest Spender: 27.8% (Warren Sapp, Brad Johnson, & Simeon Rice- 2002 Buccaneers)
Lowest Spender: 17.4% (Ogden, Ray Lewis, & Michael McCrary- 2000 Ravens)
I was a bit surprised to see the Tampa Bay Buccaneers team rank so high since everyone associates Brad Johnson with journeyman QB, but he was highly enough compensated along with two defensive stars to push
them to the top of the list. Not surprisingly the Ravens were at the bottom as Trent Dilfer was paid more like a journeyman with just a $1 million cap hit. We have a nice spread of data here with some current teams over the average and some under the average.
I think two of the surprises are the Patriots’ 2001 and 2004 teams. These are squads that are associated with reasonable priced QB play, but all the Patriots teams had big money invested in Ty Law and the two teams had money invested in QB- by 2004 Brady had signed a pricier extension and in 2001 Drew Bledsoe was a big earner. NE overcame a lot of salary cap waste those years to win their Super Bowls. In 2001 Bledsoe was injured and replaced and in 2004 Law only played in 7 games while their third highest cap charge came from Lawyer Milloy, a player who was released a few days before the season began.
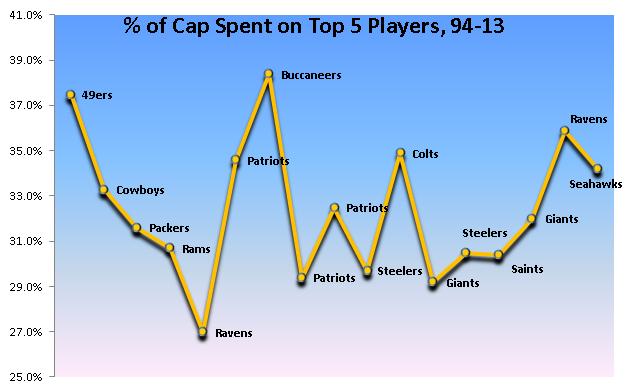
Top 5 Salary Cap Spending
Average Spend: 32.5%
Largest Spender: 38.4% (Sapp, Johnson, Rice, Derrick Brooks & Jeff Christy- 2002 Buccaneers)
Lowest Spender: 27.0% (Ogden, Lewis, McCrary, Rod Woodson, & Peter Boulware- 2000 Ravens)
On average teams allocated about 33% of the entire salary cap to just 5 players. Our two most recent NFL champions both rated above the average which was a slight jump for both teams indicating that their GMs believed in continuous spending rather than drop-offs after the top few players. In light of the last category it is not surprising to see the Bucs and Ravens rate highest and lowest. The Bucs were a veteran laden team that was near the end of their run with Jon Gruden being brought in as a replacement for Tony Dungy. The team would win just 12 games in the next two years and has been the worst futures performing Super Bowl champion, though the Giants look poised to take that title this year if they fail to advance to the playoffs. The Ravens were the very young group with a number of contributing top draft picks on the team and made the playoffs in two of the next three years, so they did better than the Bucs, but were actually towards the bottom of the list in future playoff success as well.
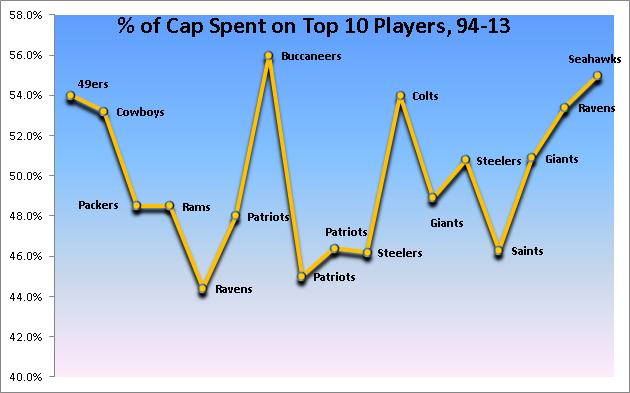
Top 10 Cap SpendingAverage Spend: 50.0%
Largest Spender: 56.0% (2002 Buccaneers)
Lowest Spender: 44.4% (2000 Ravens)
It certainly pays to be considered a good player, as Super Bowls champions invest half of their budget on less than 20% of the players on the team. One of the interesting takeaways here is that the Seahawks ranked 2nd out of 17 teams with 55% of the cap being allocated on 10 players. I think this actually goes against the popular thought about the way the team was constructed. Because the Seahawks get so much mileage out of their young talent people but this was a team that spent on veteran talent. It shows the impact of the draft on a team as they received little from Zach Miller, Sidney Rice, and Percy Harvin and others were released this season for cap considerations.
In general the more recent trends have pushed towards lower spending on the top player on the roster with increased spending on the “above average” talent base. Since 2006 only the 2009 Saints spent less than 48.9% on their top 10 players. Perhaps the most interesting teams were the Patriots dynasty teams that were big spenders up to the top 3 players, but ended up among the bottom 6 in the top 10 category.
Overall Spending Breakdowns
I just wanted to take a small sampling of the teams to see how the league spends so much on so few players. Though there will be some differences in how teams are built, once you extend rosters out to 60+ players (these include terminated contracts obviously) we can see that about 75% of funding is spent on just 25 players and 80% of all funding on just 30 players. That is essentially our starting roster and it is why I often talk about roster turnover every year and how almost nobody is safe. If you are not an entrenched starter you either need to show potential to be one or bring value added services (special teams, multiple positions, specialized packages) to keep from getting your number called in the final days of the preseason.
Complete Salary Cap Spending
So Why No Broncos?The 1997 and 1998 Broncos are one of the more well remembered champions of recent NFL history primarily because of the storybook ending to the career of John Elway. But this was still the earliest days of the salary cap and certain teams in the NFL were always finding ways to try to cheat the salary cap. Some violated the spirit of the CBA (I think every early CBA seemed to have some type of prior Dallas Cowboys loophole closed), but the Broncos remain were found in violation of the salary cap and were fined years later for these violations.
The general nature of the violations, which were found to run from 1996 to 1998, surrounded deferring large payments for star players like Elway. There were other types of guaranteed bonuses being promised to players to avoid proration treatment of the bonuses. Denver claimed that these maneuvers were simply done because they were having cash flow problems and that no benefit was gained despite the league penalties.
When tabulating the data it just felt wrong to agree with that assessment. The 5.5 and 5.3% that was spent on their top player was at least 1.2% less than the next closest teams. Their top 10 spending in 1997 was just 40.2%, 4% less than the 2000 Ravens. What those numbers are not so ridiculous, to expect a team with a Hall of Fame veteran QB to be playing for pennies is.
Elway’s cap charges in the Super Bowl seasons were just $2.1 and $2.6 million respectively. By comparison Dan Marino, who would be the most logical comparison, had cap charges of $4.3 and $7.6 million. Troy Aikman’s cap charges were both over $5 million in those seasons. Some may argue that Steve Young had low cap charges ($3.5 million), but that was also a team found in violation of the cap. So for the purposes of this study it just did not seem relevant to include this group as a reasonable way to look at building a team especially in light of the violations they were found guilty of.
Future Success
I wanted to also look at how the team performed in the three year period following the Super Bowl. Ranking them was solely based on playoff success with a team being awarded 10 points for winning a Super Bowl, 8 points for losing a Super Bowl, 6 points for the conference championship, and so on. Since we are going in a three year period we have limited our pool by three more teams.
The average score was 10.85 with a median of 10. The teams who invested heavily in one player were the teams who had the most success in the future. The 49ers, Patriots dynasty, and Manning Colts all were big playoff successes in the future. That slowly begins to shift as we move to top 10 spending as you get three of the lowest five in the top 6 of spending and four of the best teams in the bottom 6.
The following chart shows the salary cap spending for each of the teams discussed including the Denver Broncos. Clicking on the headers should allow you to change the sorting method. In our next part of the series we’ll see exactly where this money was spent.
 AgamemnonAgamemnonParticipant
This is interesting. QBs were a lower percent way back when.
Green signed a four-year, $17.5 million contract. That equaled 7.3% of the cap space.
Kurt Warner got a seven-year, $47 million contract in 2000. That 8.6% of the cap space.
I guess QBs were less valuable back then?
AgamemnonAgamemnonParticipantJim Irsay: No “out of whack” cap numbers in Luck deal
Jim Irsay: No “out of whack” cap numbers in Luck deal
Posted by Josh Alper on June 29, 2016, 6:26 PM EDT
Andrew Luck, T.Y. Hilton APThe Colts locked up their rights to quarterback Andrew Luck through the 2021 season on Wednesday, which means he’ll be 32 when he’s next scheduled to become a free agent.
Owner Jim Irsay said Wednesday that was something the team considered when putting together the six-year, $140 million pact. Irsay said, via Kevin Bowen of the team’s website, that the team factored in the rising salary cap and that they feel there are no “out of whack” cap numbers over the life of Luck’s deal.
That includes 2021, when Luck will be due an $11 million base salary and a $10 million roster bonus should the current deal remain in place. Irsay said that was designed to make using the franchise tag a possibility should the team need to go that route.
“It works with the cap,” Irsay said. “It works with tagging in the last year. I think both sides accomplished everything we wanted to do.”
The current CBA runs through 2020, so there may be changes to the franchise tag system by the time Luck’s status becomes an issue. Of more urgency will be the question of what the Colts do with the space provided by a deal they consider cap-friendly and whether it is enough to get Luck to the Super Bowl while he’s being paid at the top of the ladder for quarterbacks.
It isn’t cap friendly. It isn’t out of whack. It is almost exactly what you would expect it be. It is the same cap percent that goes at least back as far as when Warner was a Ram. imo
AgamemnonAgamemnonParticipantThe full Andrew Luck contract
Posted by Mike Florio on June 29, 2016, 5:36 PM EDTColts quarterback Andrew Luck would have made $16.155 million in 2016, the last year of his rookie deal. He traded it in for a six-year, $140 million contract.
But those broad numbers never tell the whole story, unless and until a contract like that is fully guaranteed. PFT has obtained a copy of the Luck’s entire contract, and here’s the breakdown:
1. Signing bonus of $32 million, with $18 million paid in the next 10 days and the remaining $14 million paid on March 31, 2017;
2. Base salary of $12 million in 2016, fully guaranteed at signing;
3. $3 million roster bonus earned on the fifth day of the 2017 league year and paid on March 20, 2017, which is guaranteed for skill and injury, and conditionally guaranteed for salary cap;
4. $3 million roster bonus earned on the fifth day of the 2017 league year and paid on September 18, 2017, which is guaranteed for injury only at signing;
5. $7 million base salary for 2017, guaranteed for injury only at signing and fully guaranteed as of the fifth day of the 2017 league year;
6. $3 million roster bonus earned on the fifth day of the 2018 league year and paid on March 20, 2018, which is guaranteed for injury at signing and fully guaranteed as of the fifth day of the 2017 league year;
7. $3 million roster bonus earned on the fifth day of the 2018 league year and paid on September 18, 2018, which is guaranteed for injury only at signing;
8. $12 million base salary for 2018, which is guaranteed for injury only at signing but which becomes fully guaranteed on the fifth day of the 2018 league year;
9. $6 million roster bonus earned on the fifth day of the 2019 league year and paid on March 18, 2019, which is guaranteed for injury at signing and fully guaranteed as of the fifth day of the 2018 league year;
10. $6 million roster bonus earned on the fifth day of the 2019 league year and paid on September 17, 2019, which is guaranteed for injury at signing;
11. $9.125 million base salary for 2019, non-guaranteed;
12. $11 million roster bonus due on the third day of the 2020 league year, with half paid on September 15, 2020 and the other half paid on December 15, 2020;
13. $11 million base salary for 2020, non-guaranteed;
14. $10 million roster bonus due on the fifth day of the 2021 league year, with half paid on September 14, 2021 and the other half paid on December 14, 2020; and
15. $11 million base salary for 2021, non-guaranteed.
That’s a total of six years, $139.125 million, with $44 million fully guaranteed at signing. Another $16 million becomes fully guaranteed, as a practical matter, as of the fifth day of the 2017 league year.
At signing, $87 million is guaranteed for injury.
The cash flow breaks down like this: $44 million in 2017; $57 million through 2018; $75 million through 2018; $96.125 million through 2019; $118.125 million through 2020; $139.125 million through 2021.
It’s an average value of $23.1875 million per year, with $24.594 million per year in so-called “new money.”
The cap numbers are: (1) $18.4 million in 2016; (2) $19.4 million in 2017; (3) $24.4 million in 2018; (4) $27.525 million in 2019; (5) $28.4 million in 2020; and (6) $21 million in 2021.
AgamemnonAgamemnonParticipant
Above we figured it as a 6 year contract, 12.8% of the salary. If we just use the 5 year numbers, it is 13.2% of the salary cap. The projected percentage for a franchise QB is 12.8% of the salary cap. However it is figured, it is pretty close. imo
Wow, The guaranteed numbers are very complicated numbers and not always what they seem. What we have here is a situation like Foles. The Colts could cut Luck in 2019 and have the virtually the same situation with Luck as we have with Foles now. imo
I am not going to attempt to explain how I arrive at that conclusion. You can trust me or not. 😉
They could cut Luck in 2020 with a minimal penalty. I think this contract was written with the intention of keeping Luck past the end of this contract. I think it is most likely that they do another extension in 2020 or 2021.
The historical figure of 12.8% of cap space, for QBs, might increase in future years, because QBs seem to becoming more scarce. I think it could go as high as 15% of cap space, although ~14% is a more likely maximum. imo
-
This reply was modified 9 years, 8 months ago by Agamemnon.
AgamemnonAgamemnonParticipantAndrew Luck's base salaries during each year of his contract: pic.twitter.com/IJPEdS1I5N
— Adam Schefter (@AdamSchefter) June 29, 2016
More details. The deals includes some bonus money, some salary guarantees, and it must have some roster bonuses. Probably, in the end, they can cut him after 4 years. Still, a lot of guaranteed money.
AgamemnonAgamemnonParticipant6-year deal $139 million
I assume that includes 2016, both in the money reported and the years.
If so that makes it an on-avg. 23.3 M dollar deal.
Comparing him to others in his contract class (young starting qbs and their 2nd contracts), that’s just a bit above Wilson’s 21.9 a year.
This suggests that by the time Goff comes up, the top avg. annual amount for deals like that will be in the 24-25 M range.
…
Right, zn.
AgamemnonAgamemnonParticipantIs he worth it?
w
vIt is exactly what you expect a franchise QB to get. Is he a franchise, QB is the question.
AgamemnonAgamemnonParticipant
Luck signed a six-year, $140 million deal Wednesday with the Colts, Irsay announced. A source informed of the deal told Rapoport that the new contract includes $60 million fully guaranteed and will average $24.6 million per season.
That doesn’t add up. 6 x 24.6 = 147.6
.
What it does add up to is 16M for 2016 and 24.6 for the next 5. $139M
.
139 / 6 = 23.17
.
6yrs for $139M.
Average salary = $23.17.
Average cap = the cap for 2016-2021. = 1089 / 6 = 181.5M
23.17 / 181.5 = 12.77% [salary cap percent]
.
Preliminary calculations indicate that this is very close to the expected rate for a franchise QB(12.84%) when you factor in the expected increases in the salary cap over the next 5 years.
What makes this contract sweet is the massive guaranteed money. Of course, not all guaranteed money is equal. Try to get $87M, using the contract information below. 😉
-
This reply was modified 9 years, 8 months ago by Agamemnon.
AgamemnonAgamemnonParticipantAndrew Luck signs six-year, $140 million Colts contract
By Gregg Rosenthal
Around The NFL Editor
Published: June 29, 2016 at 04:26 p.m.Colts owner Jim Irsay promised a “shocking” contract for his franchise quarterback Andrew Luck way back in February. That’s why it wasn’t shocking when the Colts announced Wednesday that Luck signed a new contract that makes him the highest-paid player in the NFL.
Luck signed a six-year, $140 million deal Wednesday with the Colts, Irsay announced. A source informed of the deal told Rapoport that the new contract includes $60 million fully guaranteed and will average $24.6 million per season. The contract will pay him $75 million over the first three years of the deal and slightly less over the final two years. In addition, he’ll earn $87 million in guarantees.
Luck’s mammoth contract surpasses the $22.1 million per-season average of Joe Flacco’s contract — now the league’s second-richest deal.
The Amazon Original Series “All or Nothing: A Season with the Arizona Cardinals” Premieres on Prime video July 1.The news is not a surprise, but the timing of it shows the extreme faith the Colts have in Luck. He’s coming off a down 2015 season plagued by injuries. Luck admitted he was playing poorly even before a shoulder injury forced him to miss two early starts. A lacerated kidney ended his season after Week 9.
The Colts smartly took the long view. Franchise quarterbacks are the most valuable commodity in sports and we’d argue they are all undervalued because of the salary cap. To put it another way: would you rather have one Andrew Luck or two Ryan Kerrigans? The Colts placed more importance the first three extraordinary seasons of Luck’s career far more than last season, as they should. Luck was sixth in the NFL in passing yards from 2012-2014. Irsay knows how incredibly fortunate the Colts were to replace Peyton Manning with another potential top-shelf quarterback.
“This is an exciting day for the organization and Colts fans around the globe,” Irsay said in a statement. “Andrew is the consummate professional, possesses extraordinary talent and is our leader on and off the field. When you consider what this team has accomplished in four seasons with Andrew under center, you cannot help but be thrilled about the future.”
The Colts made the playoffs in Luck’s first three seasons with 11-5 records, advancing further in the postseason each year. Luck’s postseason efforts encapsulated his career in many ways. He combined a lot of jaw-dropping big plays with occasional recklessness. The Colts’ defense ultimately let him down, giving up more than 40 points in three of the games.
Luck has promised to be more careful with his body in 2016, with a plan to slide more often when he runs out of the pocket. In so many ways, Luck’s early career is reminiscent of Cam Newton, the man taken No. 1 overall the year before him. The two players both have incredible (and similar) physical traits. They add a ton of value as runners and create “wow” plays throwing the ball that didn’t exist a generation ago. Both players can be streaky with accuracy and can occasionally trust their brilliant ability to escape pressure too much.
The difference is that Luck piled up big passing numbers faster and Newton has been more durable. Luck led the league in touchdown throws in 2014 and was third in passing yards, in part because he was trying to keep up with the Colts’ lackluster defense.
The Colts have struggled to protect Luck, and invested multiple picks on the offensive line heading into this season. The team has a terrific young core around Luck like it once did with Manning: receiver T.Y. Hilton and tight end Dwayne Allen are signed long term and buttressed by promising youngsters Donte Moncrief and Phillip Dorsett. Luck has proven he has broad enough shoulders to carry an organization, and we’d expect him to return near the top of the passing yards charts this year. Even if he ranks low in quotability with the media.
“I am thrilled and excited to continue with this great organization,” Luck said Wednesday in a statement. “I am thankful to the Irsay family and Mr. Irsay for providing me with this great opportunity and the trust that they’ve shown in me. I can’t wait for this season to start.”
Luck wants to prove to his teammates and himself that last year was an aberration. Irsay and company certainly believe that is true. In the meantime, Luck has a few extra bucks to fund his book club.
AgamemnonAgamemnonParticipantI guess Kroenke is really upset that St. Louis made the whole process look bad? They never expected St. Louis to come through.
AgamemnonAgamemnonParticipantHow the Rams can find money.
They have $0.6M, after budgeting for the expense in 2016.
The gain another $0.6M by paying Bailey $90k this year.
Trade or cut Foles and another team pays his salary. That means they can gain up to $1.75M due to offset language in his contract.
Depending on when they book the remaining Foles $1.0M bonus, they don’t have a negative this year and it remains on next year.
They gain $0.5M when they add a player, cause they drop the lowest salary and use it as part of the payment for the new player.
All together that means they can have .6+.6+1.75+.5 = ~$3.5M cap to spend.
Forgot that the offset for Foles might not kick in until next year, remember Finnegan. To realize the $1.75M, they would have to trade Foles. But the Rams would still have ~$2M cap to spend this year.If the Rams want bigger chunks of money, then they are looking cutting a player or restructuring a contract.
We pegged the currant salary cap, figured Foles and Bailey, did a model roster, and found that you can calculate contracts and find meaning in contracts using using money per year. This was a good week.
AgamemnonAgamemnonParticipantMike Singletary says he’ll be a defensive advisor to Rams this season
Mike Singletary says he’ll be a defensive advisor to Rams this season
Posted by Josh Alper on June 28, 2016, 12:41 PM EDT
Chicago Bears linebacker Mike Singletary competes in a flag-football legends game during 2005 Pro Bowl week in Ko Olina, Honolulu February 11, 2005. (Photo by Al Messerschmidt/Getty Images) Getty ImagesThe death of Buddy Ryan on Tuesday has led to remembrances from around the football world, including many from players he coached across many stops in his long career.
Mike Singletary was one of the leaders of the most famous defense that Ryan put together. The 1985 Bears defense ransacked the league on their way to the Super Bowl, which ended with Ryan being carried off the field along with head coach Mike Ditka. Singletary has spoken about his respect for Ryan many times, including saying that he would have been just another guy if not for Ryan’s tutelage during the recent 30 for 30 film about that Bears team.
Singletary followed in Ryan’s footsteps by becoming a coach when his playing days were over and rose to head coach of the 49ers for two-plus seasons before moving back into the assistant ranks with the Vikings from 2011-2013. He’s been out of the league for the last couple of years, but said during an interview with 670 The Score in Chicago on Tuesday that he’ll be back at work in 2016.
He’ll be working with another of Ryan’s former charges as a defensive advisor for the Rams. Rams head coach Jeff Fisher spent 1985 on injured reserve after playing for the Bears for the previous four seasons and interviewed Singletary for a defensive coordinator vacancy in 2013 before moving in a different direction.
There’s been no word from the Rams about what Singletary’s duties will be in Los Angeles at this point, but, as with all defenses, the ultimate goal will be to get as close to that 1985 Bears ideal as possible.
AgamemnonAgamemnonParticipantThat should be interesting. Is he going to be a consular? a LBer coach? a TE coach? a motivational speaker?
AgamemnonJune 28, 2016 at 11:33 am in reply to: Matt Bowen: offseason rules are brutal for QB development #47316AgamemnonParticipantI want to see the QB do it all. But I think they should keep what they can of the stuff he already does well. If he has a strength, why throw it away? They don’t have to go to a spread offense, but some of the stuff has to be worth while.
It might not be the spread offense itself. But that those QBs have so much to learn to learn to do what they are expected to do in the pros. Like read complex defenses on the fly and understand play calling, etc. imo
AgamemnonJune 28, 2016 at 2:50 am in reply to: Wagoner & co. — Which Seahawks player irks your team most #47285AgamemnonParticipantGolden Tate
Agamemnon -
This reply was modified 9 years, 8 months ago by
-
AuthorPosts