
Recent Forum Topics › Forums › The Rams Huddle › One Kind of Salary Cap Model archive***
- This topic has 27 replies, 3 voices, and was last updated 9 years, 11 months ago by
 zn.
zn.
-
AuthorPosts
-
June 17, 2016 at 7:14 am #46411
 AgamemnonParticipant
The chart above is an average of 5 playoff teams that make the playoffs regularly 7, 7, 13, and 26. The Rams are 8, 7, 14, 24.
.
The top 27 players are equal to your starters and with a couple rotational players added.
.
39 players fit under 47% of the cap. The 14 other players have to fit within 53% of the cap. These numbers aren’t exact, but you can’t stray too far. You can do a lot of squeezing, but you can only fit so much into a limited cap space.
.
If you sign a QB for 14% of the cap, that money has to come from somewhere. It is hard to take an extra 7% out of the 3 million or less, or the 1 million or less catagories. You have to take out one player from the 9+M or less cat. or move 2 players out of the 5M or less cat. imo
.
There are certainly other ways to do this. Use whatever suits you. This suits me. 😉
.
I arranged this information in a form that works for me. I can assure you that these numbers work, if they do not readily fit into what you use. That isn’t my fault. Just keep doing things the way you have been. 😉 AgamemnonJune 22, 2016 at 3:03 pm #46860AgamemnonParticipant
I figure the Rams are 6-8M short for next year. There are a couple things they might do. Not resign Britt, Ayers, Reynolds, and Quick or let Brockers walk. Any combination that saves the money works. Any players they lose will have to be replaced. By younger cheaper players.
They might restructure or extend some contracts to find savings. Say, Tavon, Macdonald, Brockers, and Johnson, If they could keep these players for less than 36M, that might work. This is pretty much like predicting the weather. 😉
Also, I think we have about 1-2M left to spend of the cap. We will probably keep that unless somebody gets hurt before the season starts. imo
AgamemnonJune 26, 2016 at 10:47 am #47107AgamemnonParticipant
So far, all the contracts I have looked at compare closely to this chart. Flacco and Suh are the only two differences that I found. Flacco got 14.0% compared to the chart value of 12.8% for QBs. Suh got 11.1% compared to ? DT = 8.7%? DE = 10.1%? He is a DT, but he impacts game as much as a DE. The highest number for a defensive player is DE, so I will that, 10.1% for ‘best defensive player’.
Cox, a top DT, got 9.0%. And he got 4 years guaranteed. Only elite players get more than 2 years of real guarantees, according into Andrew Brandt.
JJ Watt got 9.2%
Olivier Vernon got 9.4%
Rogers got 13.2%
Wilson got 12.7%It will be interesting to see what Luck gets, in the next big QB contract.
-
This reply was modified 9 years, 12 months ago by
 Agamemnon.
AgamemnonJune 26, 2016 at 12:16 pm #47124 znModerator
JJ Watt got 9.7%
Olivier Vernon got 9.9%
Rogers got 13.3%
Wilson got 12.7%Good work.
What was Quinn?
June 26, 2016 at 12:17 pm #47125znModeratorI figure the Rams are 6-8M short for next year. There are a couple things they might do. Not resign Britt, Ayers, Reynolds, and Quick or let Brockers walk.
Saffold?
June 26, 2016 at 12:51 pm #47136AgamemnonParticipantRobert Quinn signed a 4 year, $57,014,895 contract with the St. Louis Rams, including a $4,776,774 signing bonus, $41,171,774 guaranteed
Quinn is 8.3%, but that was before they realized the cap would increase as much as it has, imo
42M was a large guarantee, elite status, still well under the 10.1% value of a franchise DE. imoHe signed in 2014. So, the Rams got years 2016, 17, 18, and19 added for new money of $57M. The cap for 214 was$133M. They were probably figuring an increase of $5-7M/yr. I estimate that he signed for ~8.9%, which was a bargain, even back then. imo
Saffold?
Cutting Saffold is another option.
AgamemnonJune 26, 2016 at 1:12 pm #47142AgamemnonParticipantYou can think of it this way, instead of Quinn signing for 4yrs for $57M, he would have needed to signed for 4yrs for ~$69M to get the franchise number of %10.1.
You can look up the deals for Watt and Vernon and figure Quinn gets 10% less than their deals, over the same years.
Watt 6yrs for $100,000,000 = $90M over 6 yrs for Quinn. 2016 – 2021-
This reply was modified 9 years, 12 months ago by Agamemnon.
AgamemnonJune 26, 2016 at 1:46 pm #47146AgamemnonParticipantI went back and redid Flacco, cause I just couldn’t believe it was that far off. I did his last 2 contracts. They covered 9yrs, 2013 – 2021. His number is then 12.3%, which is just under the franchise value for QB of 12.8%. Flacco is just under a franchise QB. That makes more sense to me. 😉
Suh is my only outlier at 11.1% vs 10.1% and that probably stays that way.
AgamemnonJune 26, 2016 at 7:27 pm #47171AgamemnonParticipantIf the Rams had cut Saffold this year. $4M.
If the Rams had not signed Coty this year. $5M.
They still have cap space to play with, $2M.
……..That equals $11M.
Jenkins cap this year is $8M.
They could have kept him if they really wanted to. imo AgamemnonJune 26, 2016 at 10:14 pm #47174 NewMexicoRamParticipant
Man, ALL of you guys could sure give Demoff a run for the money!
Great analysis, all around!June 27, 2016 at 6:21 am #47191AgamemnonParticipant
Next year is the year the Rams have to decide about the 5th year option on Robinson and Donald. This won’t affect them until 2018.
I guees Dominique Easley would be eligible for the 5th year option too. He will also be a RFA next year.

These are the Rams’ restricted free agents. It they get tendered, their salary will one of three tenders.
For 2016, the tender amounts were $1.671 million, $2.553 million, and $3.635 million, respectively.
The exclusive rights free agents get the minimum wage.
National Football League usage
Exclusive-rights free agents
Exclusive-rights free agents (ERFAs) are players with two or fewer seasons of service time and whose contracts have expired. If their team tenders a qualifying offer (a one-year contract usually at league-minimum salary) the player has no negotiating rights with other teams, and must either sign the tender with the team or sit out the season.[5]
Restricted free agents
Restricted free agents (RFAs) are players who have three or fewer accrued seasons of service and whose contracts have expired. RFAs have received qualifying offers from their old clubs and are free to negotiate with any club until a deadline which occurs approximately a week prior to the NFL Draft (for 2010 the deadline was April 15), at which time their rights revert to their original club. If a player accepts an offer from a new club, the old club will have the right to match the offer and retain the player. If the old club elects not to match the offer, it may receive draft-choice compensation depending on the level of the qualifying offer made to the player.[6]
https://en.wikipedia.org/wiki/Free_agent
NFL sets restricted free agency tenders for 2016
NFL sets restricted free agency tenders for 2016
Posted by Mike Florio on March 8, 2016, 8:49 PM EDTThe 2011 Collective Bargaining Agreement makes restricted free agency less important than it used to be, because all rookie contracts now have a base duration of four years. As a result, restricted free agency becomes relevant only when an undrafted player finishes three years of service, or when a drafted player is cut before the completion of three years and has a contract that expires following his third accrued season.
It’s still an important aspect of the process, especially when quality players become legible for restricted free agency.
Restricted free agents can be held in place through the application of one of three tenders. The lowest level provides a right or first refusal. The second-round tender provides a right of first refusal and (duh) a second-round pick as compensation if the original team doesn’t match. The first-round tender carries a right of first refusal and a first-round pick as compensation.
This year, the tender amounts are $1.671 million, $2.553 million, and $3.635 million, respectively.
Arguably the biggest name this year in the RFA class belongs to Broncos running back C.J. Anderson. When the market opens on Wednesday, he’s expected to draw significant interest, given that Denver opted to save roughly $900,000 by not tying a second-round pick to Anderson.
AgamemnonJune 27, 2016 at 8:17 am #47195AgamemnonParticipantBreaking down Nick Foles’ $26.068 million extension
Posted August 12, 2015 ·St. Louis Rams quarterback Nick Foles’ two-year contract extension is worth $26.068 million and includes a $3 million signing bonus, according to a source with knowledge of Foles’ deal.
Foles got $13.792 million guaranteed.
In 2015, he’s due a fully guaranteed $1.042 million base salary and has $6.068 million in total compensation with a $4.068 million salary-cap figure.
The deal has no offset language in the first year.
Foles gets a $2 million roster bonus on Sept. 1. That’s guaranteed for skill and injury at signing, guaranteed for salary cap if on the roster on Aug. 15.
Foles has an annual $4.5 million in not likely to be earned incentives based on Pro Bowl; p/t + wins or playoffs or playoff wins; p/t + wins or playoffs or playoff wins and Club/player rankings.
Foles has workout bonuses of $6,240 and $20,000 in 2015.
In 2016, he has a $.175 million base salary and a $8.75 million salary-cap figure. The salary is guaranteed for injury at signing and skill and cap if on the roster the fifth day of the 2016 league year and includes offset language.He’s due a $6 million roster bonus on the third day of the 2016 league year, guaranteed for skill and injury at signing, guaranteed for cap if on the roster on Aug. 15, 2016 and has no offset language.
In 2017, he has a $13.25 million salary cap figure and a $10.75 million nonguaranteed base salary.
He has a $1.5 million roster bonus due on the third day of the 2017 league year.
Finally found the exact Foles contract. The offset language, for his salary this year, is the key. This means that like Finnegan, the Rams can get some or all of his salary back, even if they cut him. A trade takes them off the hook. The other team honors Foles’ contract.There is still $1 million of the $3 million signing bonus left on the books. The best the Rams can do is gain $.75 million and that might not come this year. If he is cut, the offset kicks in next year.
It appears the $1 million of the $3 million signing bonus doesn’t have to be booked this year. The Rams can wait until next year if they want. See below.
http://overthecap.com/explaining-the-june-1st-designation/
Explaining the June 1st Designation
Posted on February 21, 2013 by Jason FitzgeraldOne of the questions I get a lot deals with what a “post June 1” cut is and how designating someone a June 1 cut helps my team. So lets talk a bit about that today.
What we are talking about here deals strictly with the acceleration of prorated bonus money onto the current years salary cap. The NFL essentially breaks up its salary cap accounting for bonuses into two periods with June 1 being the trigger date. When a player is removed from a players roster prior to June 1st all his remaining unamortized bonus money immediately accelerates onto the salary cap. To illustrate this we see how the Kansas City Chiefs gave Steve Breaston a $5 million dollar signing bonus in 2011, which was accounted as $1 million in yearly expenses over the course of his 5 year contract. When he was released just the other day he had only completed 2 years of his 5 year contract meaning the Chiefs salary cap had only accounted for $2 million of the $5 million paid in 2011. The balance of $3 million dollars immediately accelerates onto the Chiefs 2013 salary cap.
After June 1 the NFL changes the way the acceleration works. After June 1st only the current years expense remains on the books after the player is released. The balance accelerates onto the following years salary cap. So in Breastons case had the Chiefs waited until June 1st to release him his salary cap charge in 2013 would have been $1 million and in 2014 he still would be on the books at $2 million dollars.
This rule is really another way in which the league holds tremendous power over the players. In some cases the acceleration of bonus money could throw a teams salary cap into chaos, if higher than the players current cap charge as an active player. Since teams need to remain under the cap at all times once the League Year begins the potential of the acceleration onto the current years cap would prevent a players release and allow them to continue earning their salary for the year. Instead they are thrust into a pool of summertime free agents when most teams are strapped for cap space and have made many of the decisions about their roster.
I think where many people get confused, though, is when they hear that “player x” could be designated a June 1 cut and immediately jump to conclusions that it means a spending spree in March. The league allows each team to designate up to two players per year as a June 1 cut for cap purposes prior to June 1. It’s the one concession that was given to the players as it allows a player to be cut in March and have time to explore free agency but have his cap hit spread out over two seasons, thus creating more cap space in the current year. The issue though is the mechanism by which this works.
When you designate someone as a June 1 cut the player and his current contract remain on the books until June 1. Going back to the Breaston example has he been designated a June 1 cut his cap charge today would not be $1 million with $2 million on the books in 2014. His cap charge would be $5 million dollars, the same cap charge as if they never cut him at all. When June 1st hits his cap then moves down to $1 million and the other $2 million accelerate into the 2014 season. By that point in time free agency is finished and the extra cap room does not do the team much good. They would have been in a far better cap position during the important time of free agency by releasing Breaston outright as the Chiefs did.
The real purpose of the June 1 designation option is to benefit teams that have poor salary cap situations and need to either create space for rookie signings over the summer months or to cut players from the roster whose dead money charges are greater than their charge to remain on the team. In recent years this would be teams like the Dallas Cowboys and Oakland Raiders who have entered into some overpriced contracts for multiple players leaving them tight against the cap every season. The acceleration from one of these underperforming players would put the team over the cap or close enough to it to make it difficult to sign the draft class. Often waiting until June 1 is not an option because of offseason bonus money that would be due to the player if he is on the roster so the only option is to designate him a June 1 cut. So the rule gives the team the ability to avoid paying the player a bloated salary while also avoiding more cap problems. But by no means is it going to be a way to spend more money in the early stages of free agency and it does nothing to improve a teams cap position in March.
AgamemnonJune 27, 2016 at 5:11 pm #47241AgamemnonParticipantI want to see the Rams trade Foles. But, if one of our QBs gets hurt, then Foles could be as good of an answer as we have. Using Foles doesn’t cost anymore than than finding another QB.
AgamemnonJune 30, 2016 at 7:04 am #47514AgamemnonParticipanthttp://overthecap.com/nfl-salary-cap-super-bowl-champions-part/
The NFL Salary Cap and Super Bowl Champions, Part I
Posted on August 18, 2014 by Jason FitzgeraldSalary cap research, at least outside of an NFL organization, is pretty much an empty field. It’s understandable as salary cap numbers were always something that would be briefly mentioned in an article about a team and were not exactly public knowledge. There were more resources when various salary cap sites doing their best to track their favorite teams began springing up. I believe Miguel’s Patscap.com was the first site. Ian Whetstone, who contributes to OTC from time to time, kept (and still keeps) these great word docs and spreadsheets detailing salary cap reports from various sources. And with sites such as OTC now there is more ability to do research on current trends. But historical data is still a tough subject to come by.
For this series of posts I wanted to get together as much accurate historical data as I could and start looking at just how Super Bowl champions spend their salary cap dollars in building a championship team. So for this series we will go all the way back to 1994 and look at how each Super Bowl team was built. My focus is on top of the roster spending because that is the area that eats up essentially half a teams’ budget and is what we discuss the most on the site.
In part 1, which is today’s entry, we are going to look at the percentage of adjusted salary cap spent on the top player, top 3 players, top 5 players, and top 10 players on a roster. In part 2 we will look at the positional allocations among the teams. Finally in part 3 we’ll take a look at these trends and apply them to today’s NFL and see which teams most closely resemble the salary cap construction of Super Bowl champions.
There are a few things to keep in mind about the numbers. One is that the 2010 Green Bay Packers are not included because the year had no salary cap and thus there is no basis to rate their salary cap spending. The second is that, when discussing the spending I will be eliminating the 1997 and 1998 Denver Broncos from the discussion. I’ll include a separate section to explain that later in this post..
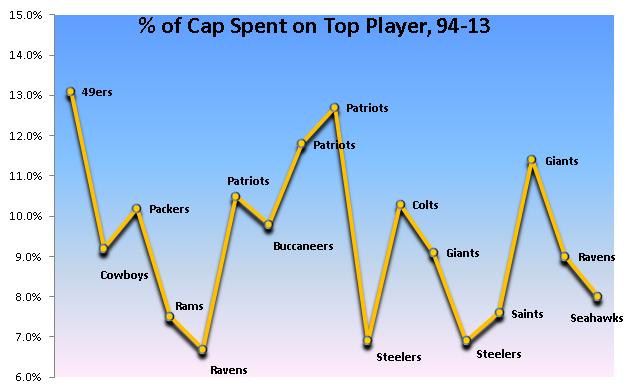
Top Player Salary Cap Spending
Average Spend: 9.5%
Largest Spender: 13.1% (Steve Young- 1994 49ers)
Lowest Spender: 6.7% (Jon Ogden- 2000 Ravens)
Just 7 of the 17 Super Bowl Champions of the salary cap era spent more than 10% of their entire salary cap on their highest priced player, with four of those teams coming between the 2001 and 2006 seasons (all three Patriots champions and the 2006 Colts). In general the trend has been towards less spending in recent years with 6 of the lowest spenders having come post 2005. I would tend to think that this could be due to teams putting more of an emphasis on drafting than veteran free agent starters, though it could also be teams being more effective for one year manipulation of the salary cap.
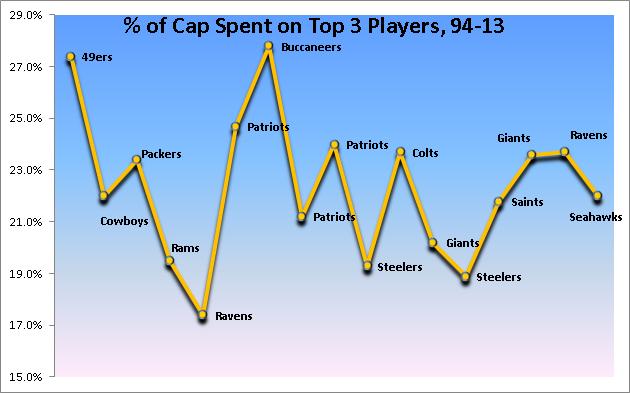
Top 3 Salary Cap Spending
Average Spend: 22.4%
Largest Spender: 27.8% (Warren Sapp, Brad Johnson, & Simeon Rice- 2002 Buccaneers)
Lowest Spender: 17.4% (Ogden, Ray Lewis, & Michael McCrary- 2000 Ravens)
I was a bit surprised to see the Tampa Bay Buccaneers team rank so high since everyone associates Brad Johnson with journeyman QB, but he was highly enough compensated along with two defensive stars to push
them to the top of the list. Not surprisingly the Ravens were at the bottom as Trent Dilfer was paid more like a journeyman with just a $1 million cap hit. We have a nice spread of data here with some current teams over the average and some under the average.
I think two of the surprises are the Patriots’ 2001 and 2004 teams. These are squads that are associated with reasonable priced QB play, but all the Patriots teams had big money invested in Ty Law and the two teams had money invested in QB- by 2004 Brady had signed a pricier extension and in 2001 Drew Bledsoe was a big earner. NE overcame a lot of salary cap waste those years to win their Super Bowls. In 2001 Bledsoe was injured and replaced and in 2004 Law only played in 7 games while their third highest cap charge came from Lawyer Milloy, a player who was released a few days before the season began.
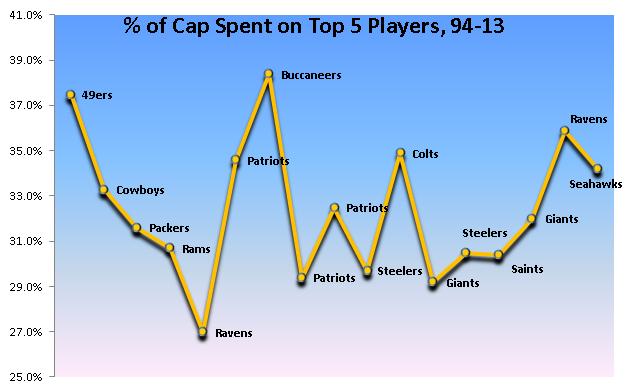
Top 5 Salary Cap Spending
Average Spend: 32.5%
Largest Spender: 38.4% (Sapp, Johnson, Rice, Derrick Brooks & Jeff Christy- 2002 Buccaneers)
Lowest Spender: 27.0% (Ogden, Lewis, McCrary, Rod Woodson, & Peter Boulware- 2000 Ravens)
On average teams allocated about 33% of the entire salary cap to just 5 players. Our two most recent NFL champions both rated above the average which was a slight jump for both teams indicating that their GMs believed in continuous spending rather than drop-offs after the top few players. In light of the last category it is not surprising to see the Bucs and Ravens rate highest and lowest. The Bucs were a veteran laden team that was near the end of their run with Jon Gruden being brought in as a replacement for Tony Dungy. The team would win just 12 games in the next two years and has been the worst futures performing Super Bowl champion, though the Giants look poised to take that title this year if they fail to advance to the playoffs. The Ravens were the very young group with a number of contributing top draft picks on the team and made the playoffs in two of the next three years, so they did better than the Bucs, but were actually towards the bottom of the list in future playoff success as well.
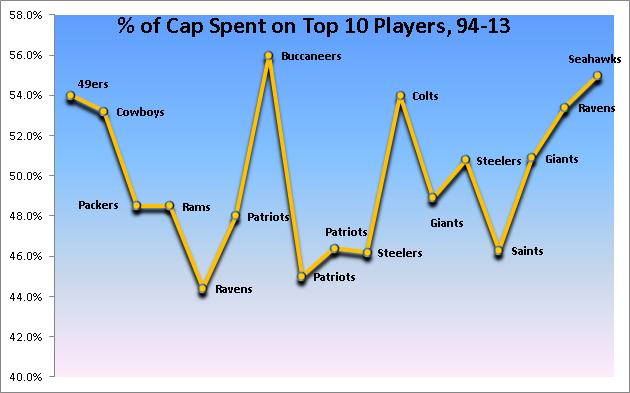
Top 10 Cap SpendingAverage Spend: 50.0%
Largest Spender: 56.0% (2002 Buccaneers)
Lowest Spender: 44.4% (2000 Ravens)
It certainly pays to be considered a good player, as Super Bowls champions invest half of their budget on less than 20% of the players on the team. One of the interesting takeaways here is that the Seahawks ranked 2nd out of 17 teams with 55% of the cap being allocated on 10 players. I think this actually goes against the popular thought about the way the team was constructed. Because the Seahawks get so much mileage out of their young talent people but this was a team that spent on veteran talent. It shows the impact of the draft on a team as they received little from Zach Miller, Sidney Rice, and Percy Harvin and others were released this season for cap considerations.
In general the more recent trends have pushed towards lower spending on the top player on the roster with increased spending on the “above average” talent base. Since 2006 only the 2009 Saints spent less than 48.9% on their top 10 players. Perhaps the most interesting teams were the Patriots dynasty teams that were big spenders up to the top 3 players, but ended up among the bottom 6 in the top 10 category.
Overall Spending Breakdowns
I just wanted to take a small sampling of the teams to see how the league spends so much on so few players. Though there will be some differences in how teams are built, once you extend rosters out to 60+ players (these include terminated contracts obviously) we can see that about 75% of funding is spent on just 25 players and 80% of all funding on just 30 players. That is essentially our starting roster and it is why I often talk about roster turnover every year and how almost nobody is safe. If you are not an entrenched starter you either need to show potential to be one or bring value added services (special teams, multiple positions, specialized packages) to keep from getting your number called in the final days of the preseason.
Complete Salary Cap Spending
So Why No Broncos?The 1997 and 1998 Broncos are one of the more well remembered champions of recent NFL history primarily because of the storybook ending to the career of John Elway. But this was still the earliest days of the salary cap and certain teams in the NFL were always finding ways to try to cheat the salary cap. Some violated the spirit of the CBA (I think every early CBA seemed to have some type of prior Dallas Cowboys loophole closed), but the Broncos remain were found in violation of the salary cap and were fined years later for these violations.
The general nature of the violations, which were found to run from 1996 to 1998, surrounded deferring large payments for star players like Elway. There were other types of guaranteed bonuses being promised to players to avoid proration treatment of the bonuses. Denver claimed that these maneuvers were simply done because they were having cash flow problems and that no benefit was gained despite the league penalties.
When tabulating the data it just felt wrong to agree with that assessment. The 5.5 and 5.3% that was spent on their top player was at least 1.2% less than the next closest teams. Their top 10 spending in 1997 was just 40.2%, 4% less than the 2000 Ravens. What those numbers are not so ridiculous, to expect a team with a Hall of Fame veteran QB to be playing for pennies is.
Elway’s cap charges in the Super Bowl seasons were just $2.1 and $2.6 million respectively. By comparison Dan Marino, who would be the most logical comparison, had cap charges of $4.3 and $7.6 million. Troy Aikman’s cap charges were both over $5 million in those seasons. Some may argue that Steve Young had low cap charges ($3.5 million), but that was also a team found in violation of the cap. So for the purposes of this study it just did not seem relevant to include this group as a reasonable way to look at building a team especially in light of the violations they were found guilty of.
Future Success
I wanted to also look at how the team performed in the three year period following the Super Bowl. Ranking them was solely based on playoff success with a team being awarded 10 points for winning a Super Bowl, 8 points for losing a Super Bowl, 6 points for the conference championship, and so on. Since we are going in a three year period we have limited our pool by three more teams.
The average score was 10.85 with a median of 10. The teams who invested heavily in one player were the teams who had the most success in the future. The 49ers, Patriots dynasty, and Manning Colts all were big playoff successes in the future. That slowly begins to shift as we move to top 10 spending as you get three of the lowest five in the top 6 of spending and four of the best teams in the bottom 6.
The following chart shows the salary cap spending for each of the teams discussed including the Denver Broncos. Clicking on the headers should allow you to change the sorting method. In our next part of the series we’ll see exactly where this money was spent.
 AgamemnonJune 30, 2016 at 7:05 am #47515AgamemnonParticipant
http://overthecap.com/nfl-salary-cap-super-bowl-champions-part-ii/
The NFL Salary Cap and Super Bowl Champions Part II
Posted on August 26, 2014 by Jason FitzgeraldIn Part I of our look back at the salary cap spending of Super Bowl Champions we looked at spending on the top spots of the roster. In this one we want to look at the positional breakdowns of those top roster spots on the champions. Just as a quick reminder we are not including the 97 and 98 Broncos due to salary cap violations nor the 2010 Packers since the 2010 season had no salary cap. All figures are based on percent of the teams adjusted salary cap to adjust for the differences in salaries over the large time period.
Top Player Breakdown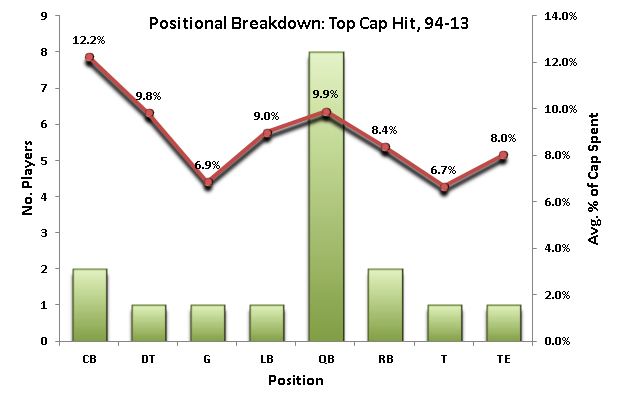
I’m sure it comes as no surprise that quarterback dominates the top salaried player on the team as 8 of 17 champions have spent the most money on the QB. I would have expected to see a few more pass rushers on the list, but only Terrell Suggs was the top salary cap player on his team. The highest average spending came on cornerbacks, but those were both the huge numbers spent on Ty Law by the Patriots. The two strange ones were Guard and Tight End. The high priced Guard was Alan Faneca on the lower spending Steelers team and he would not have been anywhere near the top of almost any other team except the 2000 Ravens. Zach Miller took the top spot on the Seahawks, whose roster construction was very different than almost anyone else of the Super Bowl era.
Top Three Breakdown
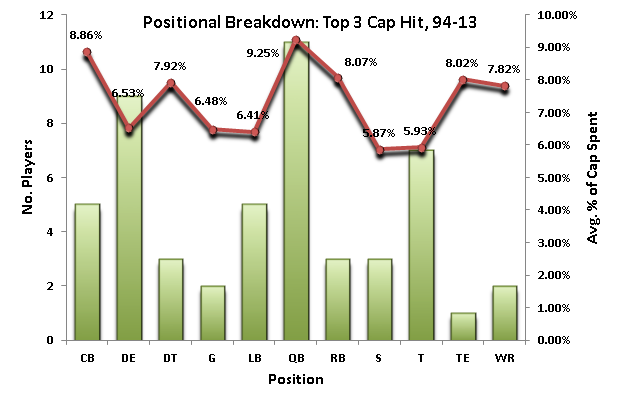
We move up to 11 QB’s once we expand to the top 3 cap charges on a team and now we get more of those pass rushers that I thought would be in the top spot. Offensive tackle also makes a big leap, which I think would be expected since teams with a high priced QB should be paying big money to protect his blindside. Five of the seven tackles who made the top three also had a QB in the top 3 in salary. Those teams were the 1994 49ers, 2006 Colts, 2007 Giants, and 2008 Steelers .
Top 5 Breakdown
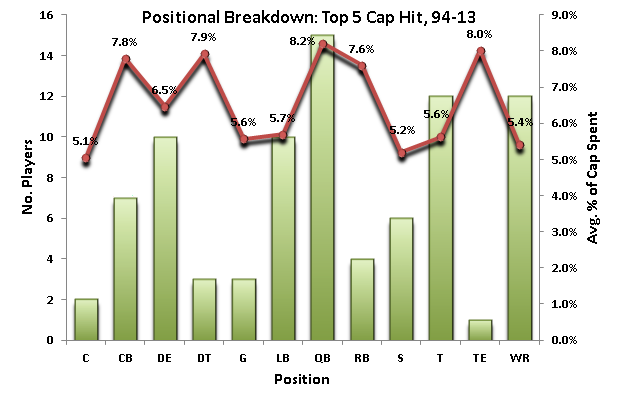
Once we extend to 5 teams we have almost every position represented (punter and kicker are missing). 15 out of 17 teams had the QB as one of the top 5 paid players on the team which is basically telling everyone that you won’t win without a reasonably compensated QB. Wide Receiver, which was almost non-existent in the top of the roster cap charges sees a massive jump to 12 players. So while teams may move away from paying them the biggest money they are certainly not shy from paying them big money. Another interesting takeaway here was the lack of running backs. Though the league was not considered a “passing league” until the last 6 or 7 years, the runners on the SB champs have not been big money earners. The 4 runners that make the list are split between the 90s era and the more pass happy era.
Top 10 Breakdown
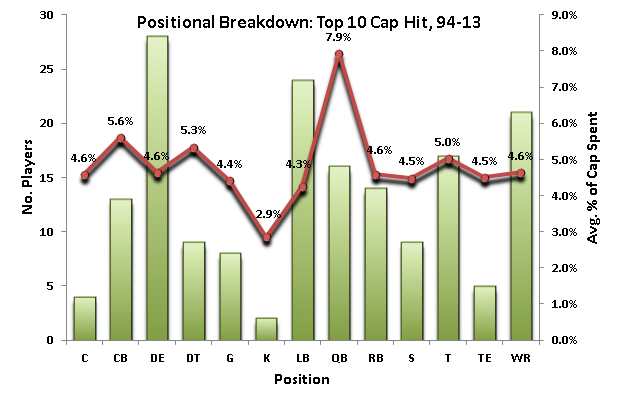
QB drops out of the top spot since there is only one spot available per team, but does remain the highest compensated. The only team that did not have a top 10 paid QB win the Super Bowl was the Seattle Seahawks in 2013. The most popular positions are the Defensive End and Linebacker positions. Some of those linebackers are pass rushers, so I think its sf to say most teams want to wind up with a strong pass rush. In fact every team had at least one “pass rusher” make the top 10 salaries on the roster.
Five teams did not have a top 10 paid cornerback on the team. Those teams were the 1996 Packers, 2005 Steelers, 2006 Colts, 2008 Steelers and 2013 Seahawks. Only five teams did not have a high priced running back on the roster, all of whom won before 2008. The teams were the 1994 49ers, 2001 Patriots, 2004 Patriots, 2006 Colts, and 2007 Giants. Only four teams failed to have a high cap tackle on the payroll- the 1996 Packers, 2002 Buccaneers, 2004 Patriots, and 2012 Ravens. Just two squads did not have a top 10 paid WR. Those teams were the 2000 Ravens and the 2011 Giants.
Positions on the lower end of the salary scale did not make many appearances on the list with multiple teams passing on spending much space on centers, defensive tackles, guards, tight ends, safeties and special teamers. In general these are all the lowest salaried positions in todays NFL, though safety is becoming more and more valuable.
Offensive/Defensive Breakdown
Overall there is a pretty even split between offensive and defensive positons making up the top 10. 83 of 170 positions were defensive players and 85 were offensive players, but teams skew towards offense first and defense second. 13 offensive players are the top cap hit for a Super Bowl champ to just 4 defensive players. When we look at the top three it balances out to 26/25. When we get to the top 5, though, again we get the heavy offensive investment- 49 offensive players to 36 defensive players- before it balances out again when we look at the top 10.
The Most Non-Traditional Teams
Seattle was the only team without a top priced QB, had a top 5 paid running back and tight end, and had a top 10 defensive tackle and center. There were no cornerbacks or linebacker in their top 10. All things considered that was probably the most non-traditional built team from a salary cap perspective of all time. A very unique team that will be very hard to duplicate.
The 2006 Indianapolis Colts spent the most on offensive talent with 7 of their top 10 cap positions being held by offensive players. The opposite end of the spectrum was the 2004 Patriots with just two offensive players in the top 10. They had 7 defensive players and a kicker to round out the list.
AgamemnonJune 30, 2016 at 7:08 am #47517AgamemnonParticipant
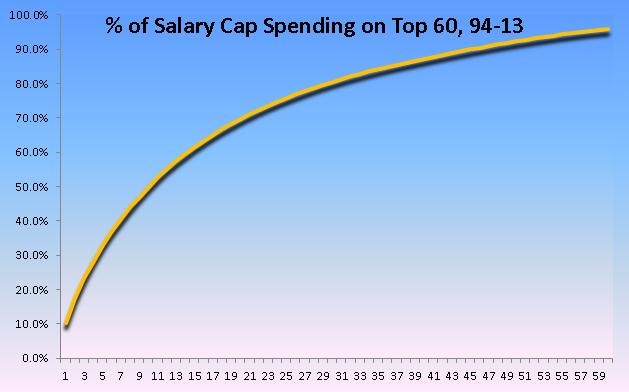
Above he as figures of 9% for 1 player, 22% for 3 players, and 32% for 5 players on superbowl teams between 1994 – 2013.
I did it in 2016 for 5 regular playoff teams and got 18% for 2 players and 30% for 4 players. 12 – 14 players equals 53 – 60%. Both groups all hit the curve in the graph.
His super bowl teams, when he counted the top 10 players, never used up more than 56% of the cap. The average was ~50%.
Since everything fits the curve above, I will take that to be the optimum model. It is derived from teams in the super bowl.

2 players at 24% and 6 players at 50%. According to my theory, 2 at 24% is Ok. 6 at 50% is not Ok. Well, it could be Ok. It might even be better than OK. But it is not an ideal fit. These are averages and how well did each super bowl team fit the average?
AgamemnonJune 30, 2016 at 2:20 pm #47564AgamemnonParticipant
We can use the graph this way, take your 4 best players. 4 players that you really really want to keep. They probably should not take up more than 34% of your cap space. Although, it would be Ok, if they took up to ?40% of your cap. You would just need to realize that what you put into your 4 best players has to come from some other place in your roster and weigh if it is best keep your 4 players or what is the best way to shape your roster.
AgamemnonJuly 1, 2016 at 2:15 am #47589AgamemnonParticipant
2013 Seahawks, plotted against an average of super bowl teams.
1 player takes 8%
3 players take 22%
5 players take 34%
10 players take 55%
28 players take 76%Seattle is not that far of the curve at any point. Seattle’s curve might not look like the curve of another team. That team might be over or under the curve at different points. Most teams will probably fit the curve though. imo There is less real difference between how teams distribute their cap dollars than it appears, at least on how close they fit the curve. imo
It is more about value. What value can you get for your cap money. A cheap QB is really big. Having a lot of young talented players is good, if it is before they get their second contract. Having players that out perform their contracts is good. Think Hayes, Donald, Gurley for the Rams. imo
AgamemnonJuly 2, 2016 at 2:40 pm #47681znModeratorBy 2020, who are the core players I would like to see as the Rams top contract guys?
I assume they all work out to deserve this. But it’s —>
Donald
Robinson
Tavon
Gurley
Goffwhich leaves room for at best 3-4 more.
Why no Quinn? Because by 2020 he is going to be a 10 year vet.
July 4, 2016 at 1:58 am #47799AgamemnonParticipant. https://www.spotrac.com/blog/nfl-minimum-salaries-for-2016-and-the-veteran-cap-benefit-rule/
.
NFL Minimum Salaries for 2016 and the Veteran Cap Benefit Rule
By Michael Ginnitti • Jan 11, 2016Each year the NFL minimum salaries increase by $15,000, up to $435k for a rookie in 2015. A player’s minimum salary is determined by his years of experience (YOE), ranging from 0 to 10 or more. The chart below shows the minimum (P5) salaries a team can contract a player to based on Years of Experience (credited seasons).

Veteran Minimum Benefits
When qualified, a player with four (4) or more years of NFL experience can earn his total minimum salary, but have a cap figure that reflects two years of experience – or in 2016, $600,000. The contract must be for only one year, and must not contain combined bonus money (signing, roster, workout) that exceeds $80,000.
For instance, let’s pretend Matt Cassel resigns with the Dallas Cowboys in 2016 on a 1 year, minimum salary contract. With 10+ years of experience, he’ll be slotted for a $985,000 base salary. With four or more years of experience (11), and a 1 year contract, Cassel qualifies for the cap hit benefit. His 2016 cap figure with the Cowboys would be $600,000
Had he received a bonus (signing, roster, workout) up to the maximum $80,000, he would have received a total $1.065M contract, with a $985,000 base salary, an $80,000 signing bonus, and a cap figure of $680,000 (600+80).
With plenty of veterans being released, or not signed back thus far in 2016, the use of the Minimum Salary Benefit Rule becomes useful both for older players looking for jobs, and teams looking to minimize their cap dollars.
Reserve/Future Contracts
The majority of Reserve/Futures contracts, as well as nearly all Un-drafted Free Agent signings this summer will include a minimum salary base contract. In the 2016 season that would include a salary of $450,000 in 2016, $540,000 in 2017, and if applicable $630,000 in 2018.
Restricted Free Agent Tenders
Most restricted free agents will be offered 1-year tenders this offseason rather than long-term extensions. Each year these tenders rise according to CBA regulation. In 2016, teams will have the right to tender their RFA as:
1st Round: $3.635M
2nd Round: $2.553M
3rd Round: $1.671M <= I think this is only right of first refusal. I will have to check that.NFL sets restricted free agency tenders for 2016
Restricted free agents can be held in place through the application of one of three tenders. The lowest level provides a right or first refusal. The second-round tender provides a right of first refusal and (duh) a second-round pick as compensation if the original team doesn’t match. The first-round tender carries a right of first refusal and a first-round pick as compensation.
AgamemnonJuly 4, 2016 at 1:59 am #47800AgamemnonParticipantAll NFL players should be making at least $1 million per year
All NFL players should be making at least $1 million per year
Posted by Mike Florio and Neil Schwartz on March 29, 2016, 10:11 PM EDT[Editor’s note: Agent Neil Schwartz recently approached me with an idea to make veteran players more attractive to teams and, more importantly, to ensure that all NFL players make a very comfortable living. The end result is a column on which Schwartz and I collaborated. Any typos are his fault.]
As the NFL and its players learn more about the realities of playing pro football, it’s more important than ever that all players receive fair compensation for the risks they assume. And by all players, that means every player. Which means that each player should have a minimum salary that reflects the maximum toll the game can take on the human body.
Currently, the league ties minimum salary to experience. For new players, it’s $450,000. For players with 10 or more years of experience, the minimum rises to $985,000. This disparity makes younger players more attractive than older ones, even with the “minimum salary benefit,” a device that provides teams with a salary-cap break on older players with minimum-salary deals, but not a cash break.
When it comes to the 29 positions on the 53-man roster that don’t go to offensive and defensive starters, cheaper is usually better. And younger is always cheaper.
Note* IR is sort of a hidden cost. You need ~7 more minimum wage players to replace players that go on IR. Let’s say 29 + 7 = 36 players on a roster of 53, which is really ~60 players that you have to account for. imo
The gap between young/cheap and old/costly gets partially bridged under the existing labor deal through the performance-based pool, which gives the lowest-paid players more money based on how much they play. Still, that money comes from the league at large; at the team level, going young on the back half of the roster means saving money. Which gives the teams even more leverage when squeezing veteran players to take less.
So why not guarantee every NFL player who is on an active roster more? The floor should be the same for all players, and the best place to start is the number that still exudes “rich.” One million dollars.
Yes, the minimum salary for all players should be the same, regardless of experience. And it should be $1 million dollars for now, with increases based upon the annual increases in the salary cap.
The adjustment will cost the owners nothing, since they’re already operating in a salary-capped environment. It will, as a practical matter, pick the pockets of some the NFL’s richest players, but maybe the league needs a dash of Robin Hood in order to ensure that all players are able to exit the sport with enough money to have made it worth their while.
As a practical matter, non-superstars who currently are making a significant amount of money would likely lose the most. But that group isn’t nearly big enough to dictate policy for the union at large. As a matter of basic fairness, those players still have every right to negotiate competitively the best possible deal within the confines of the salary cap — a dynamic that all players currently face.
Increasing the minimum salary regardless of experience will create an incentive both for teams to keep older players and for older players to keep playing. It also will make the sport even more attractive for the vast majority who currently won’t get truly rich but could die prematurely for the trying.
That latter angle could be the most important one. At a time when a smattering of veterans are walking away from the game due to concussion concerns, no rookies currently are opting out of the chance to get drafted. At some point, that could change. Putting more money on the table sooner than later could keep that from happening.
Although the current labor agreement has five years remaining on it, side deals can be reached at any time. This is a potential side deal that will help both sides significantly, a true win-win for management and labor that in turn can be a big win for most players.
AgamemnonJuly 4, 2016 at 2:00 am #47801AgamemnonParticipanttop tier 12 [your best players. ?over ~6 million] 60% ~93.2M for 2016 [ ? Upper Limit ]
middle tier 12 [the rest of the starters. ?less than ~6 million] 26% ~40.4M for 2016 [ ? Lower Limit ]
bottom tier 36 [includes IR. less than 1 million] 14.0% ~21.7M for 2016 [ Lower Limit ]
.
I will need to check some rosters to see how this stuff fits what is actaully out there. I think the bottom tier is a limit.
All your RFAs and top draft choices[rounds 1 and 2] will be in the middle, at least ?10.
All your top and middle tier players figure to be starters.
.
Players 1 – 12 have an average salary of 7.7M.
Players 13 – 24 have an average salary of 3.37M.
Players 25 – 60 have an average salary of 603k.
.
.
The Rams top 12 at 53.8% = ~83.5 million
The Rams middle 18 at 28.9% = ~44.9 million
The Rams bottom 30 at 13.3% = ~20.7 million
Rams Cap Space = 4.0% = ~6.2 million
Total…………………. 100.0% ………. $155.3
.
The Rams, 10 of 18 are RFAs and top draft choices[rounds 1 and 2] in the middle tier.
.
Players 1 – 12 have an average salary of 7.0M.
Players 13 – 30 have an average salary of 2.5M.
Players 31 – 60 have an average salary of 690k
.
The Rams have plenty of cheap young players.top tier 10-12 [your best players. ?over ~6 million] 72.0% ~111.8M for 2016 [ Upper Limit ]
middle tier 12-14 [the rest of the starters. ?less than ~6 million] 14.0% ~21.7M for 2016 [ Lower Limit ]
12-14 players would make an average of $1.5 million/year.
bottom tier 36 [includes IR. less than 1 million] 14.0% ~21.7M for 2016 [ Lower Limit ]
36 players would make an average of $0.6 million/year. AgamemnonJuly 5, 2016 at 1:04 pm #47906AgamemnonParticipant
http://www.spotrac.com/nfl/los-angeles-rams/yearly/cap/
Really nice clear look at the Rams future FAs, RFAs, and ERFAs up to year 2020. AgamemnonJuly 6, 2016 at 2:12 am #47964AgamemnonParticipant
This is my latest attempt to create a Salary Cap Roster Model. I am looking for an Archetype, the original pattern or model from which all things of the same kind are copied or on which they are based; a model or first form; prototype. Just as I view the Pound Cake as the Archetype cake. This doesn’t mean it has to be the best cake or your favorite, it is just the model from which all cakes are derived.
With the invention of baking powder, the Pound Cake evolved into the Victoria Sponge.


See more victoria sponge recipes …
http://www.bbc.co.uk/food/recipes/mary_berrys_perfect_34317 AgamemnonJuly 6, 2016 at 8:25 am #48044AgamemnonParticipantThe Blueprint to Building a Successful NFL Franchise in the Salary Cap Era
The Blueprint to Building a Successful NFL Franchise in the Salary Cap Era
By Ty Schalter , NFL National Lead Writer Oct 25, 2013Building a winning NFL team isn’t like any other construction project.
NFL executives have a budget, a crew, equipment and raw materials—but the wrecking balls start swinging the instant they’re done; all they can do is hope more of their building survives 17 weeks of destruction than any of the other 31 buildings on the same block.
A year after they started, they salvage what they can from the wreckage and start all over again.
In today’s NFL, the salary cap is stubbornly flat, making budgets tight around the league. There’s only so much cap money to go around, and the average annual value of big-money contracts seems to go up with each new contract extension.
NFL executives can’t just try to get good players at every spot on the roster; market prices and the salary cap force them to approach roster-building with a clear philosophy. Which positions will be strengths? Which positions will have depth? If any positions have strength and depth, where will they skimp?
Surveying today’s NFL landscape, is there an ideal roster-building philosophy? Go big on a quarterback? Build a smothering defense? Hoard dominant playmakers?
Is there a way to invest your team’s resources that will give you an advantage over everyone else?
Offense vs. Defense vs. Both
The first question to answer is whether it’s best to invest more heavily in offense, defense or strive to be balanced.
Obviously, if we’re waving magic wands, it’s best to have a great offense and a great defense, but we’re not waving magic wands—we’re writing checks. Let’s take a look at the 2012 playoff teams and see how they built their mousetraps.

The surest sign of strength in the NFL is points differential: The total points a team’s offense has scored, minus the total points its defense has allowed. In 2012, 11 of the 12 playoff teams were among the top 13 teams in points differential.
Only the No. 6 Chicago Bears and No. 9 New York Giants finished in the top 13 in points differential and missed out on the playoffs; only the No. 21 Indianapolis Colts were outside of the top 13 and made the postseason.
Organized from left to right, we see the Patriots with the NFL’s highest-scoring offense and No. 9 scoring defense. Not surprisingly, they had the NFL’s best scoring differential. Second best in scoring differential were the Denver Broncos, who had the No. 2 offense and No. 4 defense.
Then the pendulum swings back toward defense, with the Seahawks, 49ers and Falcons finishing third through fifth in scoring differential. Those three teams all had top-five scoring defenses, but they finished ninth, 11th and seventh in scoring offense, respectively.
The Washington Redskins were an interesting case. They finished with the No. 4 scoring offense at 27.2 points per game, but 22nd in scoring defense, allowing 24.2 points per game. The 49ers had the highest disparity the other way, with the No. 2 defense and No. 11 offense.
Outside of the Redskins defense and both units from the Minnesota Vikings and Indianapolis Colts, every playoff team’s offense and defense finished in the top 12 of the league. Here’s the table feeding that chart.

Pro Football Reference
Unfortunately for NFL executives, it looks like the answer is “both.” Even teams with exceptional offenses or defenses are at a big disadvantage if the other unit isn’t at least above average.
How Do You Get Both?
There’s only $123 million in cap money to spend. If you want a top-10 quarterback, that’s going to eat up $15 to $20 million right off the top, per Spotrac.com.
Leaving $103 million for the rest of the pot sounds like plenty, but signing one player to a $20 million contract drops the average salary available per roster spot from $2.32 million to $1.98 million. That’s a $340,000 gap across 52 roster spots in a league where the minimum rookie salary is $405,000.
Many fans love the idea of forgoing the big quarterback and spending that money bolstering the running game and defense. When the 2000 Baltimore Ravens won a Super Bowl with unheralded quarterback Trent Dilfer at the helm, they proved this model could work.
The problem: In order to pull that off, the Ravens didn’t only need one of the best scoring defenses of all time, allowing just 10.3 points per game, they also needed a top-five running game to muster a scoring offense that ranked 14th in the NFL.
In order to make up for the drag a replacement-level quarterback puts on a team, the rest of the team has to be truly exceptional.
The quarterback market is extremely efficient. As this chart shows, only Joe Flacco’s monster deal (born of a negotiation where he had unprecedented leverage) and Tom Brady’s intentional discount vary from a tight correlation between performance and pay.
There’s a reason teams are spending so much on top quarterbacks; they do wonders for the rest of the team. Avoiding interceptions is the biggest part of maximizing a team’s turnover margin, and turnover margin is a huge driver of success, on both sides of the ball. Offenses that avoid turning it over turn more drives into points, and defenses that take the ball away stop other teams from scoring.
Just look at the correlation between points differential and turnover differential.
For those of you who aren’t stats geeks, that R-squared value is what’s called the “coefficient of determination,” and it goes from zero (a quarterback’s thrown interceptions have no effect on point differential) to one (thrown interceptions are the sole factor in determining point differential).
An R-squared of 0.4683 is a very, very strong correlation, and it’s about twice as strong as the still-significant R-squared of defensive interceptions to point differential (0.2354).
Fumbles are part of turnovers too, but it’s well established that fumble recovery rates are all but completely random, and forced fumbles not much less so. Football Outsiders even publishes an annual summary of fumble luck and highlights extremely unlucky and lucky teams due for a regression to the mean.
Investing money in defense hoping to snag more turnovers won’t bear as much win-loss fruit as investing money in a quarterback who’ll make plays without turning the ball over much.
Protecting Your Investment?
Let’s say you have your franchise quarterback. (In which case, congratulations! He’ll make you look smart for as long as your checks clear.) Is it better to maximize his performance by protecting him with quality pass-blocking or surrounding him with weapons?
It’s awfully hard to isolate quality quarterback play from quality receiver play. It’s also hard to isolate quality quarterback play from quality offensive line play. Pro Football Focus team offense stats (subscription required) can get us close, though.
Let’s regress 2012’s team-adjusted net yards per attempt (a great one-number passing effectiveness stat that incorporates touchdowns, sacks and interceptions) against Pro Football Focus team “Pass” grades (incorporating the play of the quarterback and all pass-catchers).
As with the correlation between thrown interceptions and point differential, we see a huge coefficient of determination: 0.4775. If you have good quarterback play and receivers who get open and make plays, you will move the ball effectively, with more touchdowns and fewer interceptions.
Not exactly rocket science, but it confirms that PFF’s subjective grading system correlates strongly with statistical reality.
Now let’s look at the same adjusted net yards per attempt, this time regressed against PFF’s team pass-block grades.
Again, we have a significant coefficient of determination (0.197), but not nearly as huge as the connection between passing game production and quality quarterback/receiver play.
This makes intuitive sense.
The Carolina Panthers have the fourth-best PFF team pass-block grade (subscription required) so far in 2013, but they aren’t getting great receiver play, and quarterback Cam Newton got off to a slow start. The Detroit Lions are getting surprisingly solid play from their patchwork offensive line—but have invested huge money and draft picks getting Stafford weapons.
Both quarterbacks are former No. 1 overall draft picks of surpassing physical talent a year apart in age, and they are experienced enough to have ironed out any rookie luck, good or bad.
So far this season, though, Newton’s adjusted net yards per attempt is 6.25, ranked 15th in the NFL; Stafford’s is 7.30, ranked seventh.
Moneyball
Of course, the best way to maximize your cap dollars is to get talent at less cost than it’s worth.
Detroit Lions guard Larry Warford keeps quarterback Matthew Stafford clean.
The Lions rolled with depth veterans and rookie Larry Warford at three of the five offensive line spots. Per PFF, they’re getting better pass-blocking (subscription required) than teams like the St. Louis Rams and Chicago Bears, who spent big free-agent money on veteran linemen.
The word “Moneyball” has jumped the shark, according to The Washington Post’s Lydia DePillis.
She may have a point when it comes to folks slapping the word “Moneyball” for any kind of statistical optimization. Its original use still holds water, though: Sports teams can beat their competition by getting worthwhile production from players they didn’t pay free-market price for.
As the Washington Redskins found out between the time owner Dan Snyder bought the team and current general manager Bruce Allen took over, there isn’t a direct correlation between money spent and on-field production.
Follow the Blueprint
The Chiefs are the toast of the town, a worst-to-first revival that’s as unexpected as it is spectacular. How did they do it?
Head coach Andy Reid inherited a stout running game and relentless pass defense, gave up a whole lot (likely two second-round picks) to get a quarterback whose best quality is that he doesn’t throw interceptions, and added veteran pass-catchers like receiver Donnie Avery and tight end Anthony Fasano.
Avery and Fasano haven’t panned out like Reid may have hoped. By refusing to fork over huge money to extend veteran left tackle Branden Albert, though, and drafting rookie Eric Fisher to eventually replace him on the cheap, Reid and the Chiefs are following our statistical blueprint to a “T.”
This refers to their conclusion that it is better to invest in good WRs than the offensive line. You get better YPA. That might not be the best metric, but it does emphasize a point.
It’s hard to argue with the results. AgamemnonJuly 6, 2016 at 8:49 am #48046AgamemnonParticipanthttp://www.thefootballeducator.com/build-an-nfl-roster-using-jack-welch%E2%80%99s-20-70-10-approach/
Build an NFL roster using Jack Welch’s 20-70-10 approach
It’s important to note the GM’s role keeping the big picture in focus when building an NFL roster. There are numerous avenues & angles to take when adding talent to your club; reserve futures, the draft, undrafted free agents, unrestricted free agents, trades. Like a master chef, the right combination of ingredients can bring success in the kitchen, for a GM – success on the football field.
The “Business” of Football
After reading former General Electric CEO Jack Welch’s Straight From The Gut, it appeared to me that there might a good recipe here with which to assemble a professional football team from the “big picture” aspect – the 20-70-10 approach.
Described on Welch’s official website, 20-70-10 or “Differentiation” is;
Very simply, …. based on the principle that the team with the best players wins.
So in a nut shell, Welch encouraged GE’s businesses to identify and categorize their senior executives into one of three distinct categories.
A (the top 20%) the Producers
B (the middle 70%) those Vital to group as they make up the majority
C (the bottome 10%) the Non ProducersWelch surmised your top 20% (A players) were the “best of the best” and all resources/top compensation should be thrown their way. The middle 70% (B players) were a vital part of operations, the core of your workforce. You should continue to motivate and train your B’s to eventually move into the A category and push other B’s down a level. The bottom 10% (C players) should be immediately replaced. Some call it the “rank and yank” method.
Relating it to Roster Building
.
For football purposes the “ranking” evaluation MUST be based entirely upon ability & production as evaluated by your personnel staff(coaches/scouts), then handed over to salary cap administrators for proper contract structuring and negotiation via market values (not the other way around).
.
A 53 man roster (in theory) should be made up with your top 10 to 11 players as the very best compensated. A club should lean hard on self-evaluation to ensure that the best stay in the top for a long while. It’s a burden on the club to drop out of the A (20%) category if a player is not performing (due to contract structuring and CAP hit). Not many alternatives are left other than to force a reduction or cut the player before he ever drops to the C level.Level B (70%), or approximately 35 players, should (in theory) have true potential to move into your A range. These players are nurtured and coached hard to maximize next level opportunity. They should be identified for future extensions & compensation, but GM’s might want to even break this group into 1/3’s.
1/3 – Your top players ready to be extended into the A range. (the core of youth of your team)
2/3 – Journeyman players, roll players, special teams contributors
3/3 – Young developmental types, vets knowingly in their final year or falling in production.The last level (C) should be targeted (5) players a club tries to replace throughout the season with street FA’s, practice squad raids & recently released players from other clubs. These players are the bottom performers as evaluated by Player Personnel. (In theory) They are lower salaried, but could be paid higher and out of their market value range as well. Hard decisions must be made to release and take the CAP hit, or restructure the contract down. Get these guys out at the end, replace them with better players when they become available.
To help rank players a club might want to require having coaches sort the squad from 1 to 53. Then have the defense rank the offense and vice versa (based on talent and not emotion). Finally, have the scouting staff do the same. An alternative could be to use an outside source for categorizing your roster.
*Note – Key must be to differentiate based on performance and ability and not just $’s being paid. Low $ players could be A level and deserving of a raise. C level players could be grossly overpaid and in need of restructure or cut.
It’s not the perfect recipe, but certainly a good menu with which to start.
AgamemnonJuly 7, 2016 at 11:28 am #48160AgamemnonParticipant
Rams w/o Foles
top = 12 for 57.0% => 4.8%
mid = 18 for 28.7% => 1.6%
bot = 23 for 10.3% => 0.4%
cap = 4.0% AgamemnonJuly 17, 2016 at 5:46 pm #48905znModeratoroff the net from Florida_Ram

CAP PRIMER
(The Negotiator)_________________ (The Check writer)

LOS ANGELES RAMS 2016 PLAYER CONTRACTS AND SALARY CAP (Summary & Analysis)
Everyone knows that managing the Salary Cap and keeping the Rams best players under contract, is a very complicated and challenging job for Kevin Demoff to manage.
Salary Cap Guru Mr. Demoff with the advise and direction of the Coaches, GM, and scout team, all put their minds together to predict a players worth and future contract value with several intangibles involved.
As you all know, the criteria of Salary, Age, Ability, Injury history, Leadership, Character, Versatility and overall strength of the position they play, are just some of the things that go into the process of determining which players to keep on the roster.
Predictiting the future performance & vaule of a player on course with the timing of when to offer the player a contract extension (or Free Agent offer sheet) is tricky business in the NFL. The leverage of the player and his agent changes with each snap and game played leading up to the open window of time to legally negotiate.
http://www.steelergridiron.com/information/freeagents_definitions.html
http://www.askthecommish.com/freeagency/(FREE AGENT DEFINITIONS)
OFFER SHEET: A contract offer from another team signed by a (RFA), Transition Player, of Franchise Player. The player’s original team has seven days to match the offer and retain the player.
————————————————————————————————————————————QUALIFYING OFFER: An initial contract offer made to (RFAs). This offer determines what type of compensation the player’s original team receives if the RFA signs with another team. The original team is awarded draft choices from the signing team. The highest compensation is a package of 1st and 3rd round picks. Players tendered minimum offers carry compensation equivalent to the round in which they were originally drafted.
For instance, a (RFA) was originally a 6th round pick, and is given a minimum tender “Qualifying Offer.” If he signs an “Offer Sheet” with another team and the original team declines to match the offer, the original team will receive the signing team’s 6th round pick. Players who were originally rookie free agents carry no compensation if a minimum qualifying offer is tendered.
————————————————————————————————————————————COMPENSATORY DRAFT PICKS: Compensation awarded by the league to teams who lost more (UFAs) than they signed. Compensation is in the form of extra draft picks added to the end of rounds three through seven. The quantity of picks is equivalent to the difference of (UFAs) signed to (UFAs) lost. For example, if a team loses 4 UFAs and signs 1 UFA, they will receive three Compensatory Selections.
The value of the picks is determined by the difference of the contracts signed by the players lost and those acquired. The highest possible compensatory pick is the 31st of the third round (91st overall). If a team has signed an equal number or more (UFAs) than it lost, no “Compensatory Picks” are awarded.
————————————————————————————————————————————TRANSITION PLAYER: Each team may name two Transition Players and that label must remain with them until their contracts expire or until they are released. They will be paid at least the average of the top ten highest paid players at his position. A Transition Player may sign an “Offer Sheet” with any other team, but his original team has seven days to match any offer he receives. If the original team declines to match the offer, no compensation will be awarded.
————————————————————————————————————————————FRANCHISE PLAYER: Each team may name one Franchise Player and that label must remain with him until his contract expires or until he is released. He will be paid at least the average of the top five highest paid players at his position. He may sign an “Offer Sheet” with any other team, but his original team has seven days to match any offer he receives. If the original team declines to match the offer, compensation in the form of two first round draft picks in consecutive years will be awarded from the signing team.
————————————————————————————————————————————TEAM OPTION: FIRST ROUND DRAFT PICKS: Teams have the option to exercise a fifth-year option for all first-round picks. The fifth year is guaranteed for injury when employed. The fifth-year salary varies depending on how high the player was drafted. The top 10 selections receive a salary equal to the average of the 10 highest salaries at their position.
For the remainder of the first round, the wage is the average of the third through 25th highest salaries at the position. These will soon be very important decisions for the RAMS when players like Aaron DONALD & Greg ROBINSON’s Team Options come up in 2018…. GURLEY in 2019…. Goff in 2020 etc…
————————————————————————————————————————————RESTRICTED FREE AGENT (RFA): A player whose contract has expired and has fewer than four tenured years in the league. He may sign an “Offer Sheet” with any other team, but his original team has seven days to match any offer he receives. If the original team does not match the offer, compensation will be awarded in the form of draft picks from the signing team.
The round and quantity of picks are determined by the “Qualifying Offer” made by the player’s original team. If a (RFA) is tendered a minimum qualifying offer the compensation is the equivalent of the round in which that player was originally selected. If that player was originally a rookie free agent, no compensation is awarded.
————————————————————————————————————————————EXCLUSIVE RIGHTS FREE AGENT (ERFA): Which isn’t really very “free” at all. Such a player has no more than two accrued seasons in the NFL and may only sign with his prior team, provided, of course, that the team extends a minimum qualifying offer to the player.. No compensation is awarded for losing EFAs.
————————————————————————————————————————————UNRESTRICTED FREE AGENT (UFA): A player whose contract has expired and has four or more tenured years in the league. He may sign with any other team with no restrictions. If a team loses more UFAs than it signs, they will be awarded “Compensatory Draft Picks” from the league. The value of the pick is determined by the difference of the contracts signed by the players lost and those acquired. If a team has signed an equal number or more (UFAs) than it has lost, no “Compensatory Picks” will be awarded.
————————————————————————————————————————————How is the Salary Cap calculated during the offseason, when team rosters can total up to a maximum of 90 players?
Only the TOP 51 Player Salaries for a team Count against the salary cap in the offseason. (Outstanding tenders apply.) During the regular season, all player salaries count toward the salary cap.
————————————————————————————————————————————2016 Los Angeles Rams Current Salary Cap: Top 51 players counted put the Rams at approximately $6,432,531 under the Salary Cap[/color]
The Rams will again likely be the youngest team in the NFL with an approximate average age of (25.12)

PLAYERS/CONTRACTS & Salary Cap Hit (2016 LOS ANGELES RAMS)
(UFA= UNRESTRICTED Free Agent), (RFA= RESTRICTED Free Agent), (ERFA= EXCLUSIVE RIGHTS Free Agent) (Team Option= 1st Round Draft Picks)
——————————————————————————————————
(Age) …… (Player) ………. (Salary Cap Hit) .. (Year Contract Expires/Term)
(21) QB Jared GOFF ………. $5,079,577 ……. 2020 (Team Option)
(28) QB Case KEENUM …… $3,635,000 ……. 2017 (UFA)
(24) QB Sean MANNION ……. $738,734 …….. 2019 (UFA)(27) QB Nick FOLES ……….. $8,750,000 ……. 2018 (UFA)
(24) QB Dylan THOMPSON … $525,000 ……. 2017 (ERFA)
——————————————————————————————(21) RB Todd GURLEY …… $3,141,632 ……. 2019 (Team Option)
(26) RB B.CUNNINGHAM … $1,671,000 ……. 2017 (UFA)
(22) RB Tre MASON …………… $800,521 ……. 2018 (UFA)
(23) RB Malcolm BROWN …… $450,000 ……. 2018 (RFA)(28) RB Chase REYNOLDS … $862,500 ……. 2017 (UFA)
(23) RB Terrence MAGEE ……. $525,000 ……. 2017 (ERFA)
(23) RB Aaron GREEN ……….. $450,000 ……. 2019 (RFA)
(24) FB Zach LASKEY ………… $450,000 ……. 2018 (ERFA)
——————————————————————————————(27) WR Kenny BRITT …….. $4,850,000 ……. 2017 (UFA)
(25) WR Tavon AUSTIN ……. $4,057,137 ……. 2018 (UFA)
(27) WR Brian QUICK ………..$1,703,125 ……. 2017 (UFA)(21) WR Pharoh COOPER ….. $588,666 ……. 2020 (UFA)
(23) WR Bradley MARQUEZ … $527,166 ……. 2018 (UFA)
(21) WR Mike THOMAS ………. $479,017 ……. 2020 (UFA)(23) WR Nelson SPRUCE ……. $450,000 ……. 2019 (RFA)
(23) WR Duke WILLIAMS …….. $450,000 ……. 2019 (RFA)
(23) WR Paul MCROBERTS …. $450,000 ……. 2019 (RFA)
(21) WR Marquez NORTH ……. $450,000 ……. 2019 (RFA)
(25) WR Deon LONG……………. $450,000 ……. 2019 (RFA)
——————————————————————————————(28) TE Lance KENDRICKS .. $3,250,000 ……. 2019 (UFA)
(26) TE Cory HARKEY ………… $1,500,000 …… 2019 (UFA)
(23) TE Tyler HIGBEE …………… $595,215 ……. 2020 (UFA)(22) TE T. HEMMINGWAY ……. $450,000 …….. 2020 (UFA)
(25) TE J. CUNNINGHAM …….. $600,000 ……. 2018 (RFA)
(23) TE Benson BROWNE ……. $450,000 ……. 2019 (RFA)
——————————————————————————————(28) OC Tim BARNES ……….. $1,250,000 ……. 2018 (UFA)
(24) OC D. RHANEY …………….. $611,474 ……. 2018 (UFA)
(26) OC Brian FOLKERTS …….. $675,000 ……. 2017 (UFA)
(26) OC Eric KUSH ………………. $675,000 ……. 2017 (UFA)(28) OG Rodger SAFFOLD …. $5,656,250 …… 2019 (UFA)
(29) OG Garrett REYNOLDS … $2,000,021 …… 2017 (UFA)
(23) OG Jamon BROWN ………… $764,279 …… 2019 (UFA)
(24) OG Cody WICHMANN …….. $547,621 …… 2019 (UFA)
(24) OL Andrew DONNAL ………. $649,233 …… 2019 (UFA)(23) OT Greg ROBINSON …… $5,804,754 ……. 2018 (Team Option)
(24) OT Rob HAVENSTEIN ……. $902,277 ……. 2019 (UFA)
(22) OT Darrell WILLIAMS………. $527,500 ……. 2018 (RFA)(23) OT Isaiah BATTLE ………… $525,000 ……. 2018 (RFA)
(23) OT Jordan SWINDLE ……… $450,000 ……. 2019 (RFA)
(22) OT Pace MURPHY …………. $450,000 ……. 2019 (RFA)
——————————————————————————————
(26) PP Johnny HEKKER …… $2,595,995 ……. 2021 (UFA)
(28) KK Greg ZUERLEIN …….. $1,250,000 ……. 2017 (UFA)
(23) KK Taylor BERTOLET …….. $450,000 ……. 2019 (RFA)(28) LS Jake MCQUAIDE ……… $875,000 ……. 2018 (UFA)
(23) LS Jeff OVERBAUH ……….. $450,000 ……. 2019 (RFA)
——————————————————————————————SUMMARY: Rams OFFENSE in 2017 has 11 Players under contract that will become (UFA’s) or (ERFA’s) (Obviously some will not make the 53)
(28) QB Case KEENUM …… 2017 (UFA)
(27) WR Kenny BRITT …….. 2017 (UFA)
(27) WR Brian QUICK ……… 2017 (UFA)
(26) RB B.CUNNINGHAM … 2017 (UFA)
(28) RB C.REYNOLDS …….. 2017 (UFA)(29) OG G.REYNOLDS ……. 2017 (UFA)
(26) OC B.FOLKERTS …….. 2017 (UFA)
(26) OC Eric KUSH …………. 2017 (UFA)
(28) KK Greg ZUERLEIN …. 2017 (UFA)(24) QB D. THOMPSON ….. 2017 (ERFA)
(24) RB T. MAGEE ………….. 2017 (ERFA)SUMMARY: Rams OFFENSE in 2018 has 12 Players under contract that will become (UFA’s) or (ERFA’s)
(23) OT Greg ROBINSON … (Team Option 2018)
(28) OC Tim BARNES ………. 2018 (UFA)
(25) WR Tavon AUSTIN…….. 2018 (UFA)
(23) WR B. MARQUEZ …….. 2018 (UFA)
(22) RB Tre MASON…………. 2018 (UFA)
(24) OC D. RHANEY ………… 2018 (UFA)
(28) LS Jake MCQUAIDE ….. 2018 (UFA)(22) OT D. WILLIAMS ………. 2018 (RFA)
(23) OT Isaiah BATTLE …….. 2018 (RFA)
(25) TE J. CUNNINGHAM …. 2018 (RFA)
(23) RB Malcolm BROWN …. 2018 (RFA)(24) FB Zach LASKEY ……… 2018 (ERFA)
——————————————————————————————DEFENSE
(Age) ……. (Player) ……….. (Salary Cap Hit) .. (Year Contract Expires/Term)
(26) DE Robert QUINN …….. $11,157,374 ……. 2020 (UFA)
(31) DE William HAYES ……… $7,000,000 ……. 2019 (UFA)
(30) DL Eugene SIMS ………… $3,000,000 ……. 2019 (UFA)
(25) DL E. WESTBROOKS ……. $606,668 ……. 2017 (RFA)(26) DE Quinton COPLES ….. $3,000,000 ……. 2018 (UFA)
(24) DE Matt LONGACRE ……… $525,000 ……. 2017 (ERFA)
(23) DE Ian SEAU ………………… $450,000 ……. 2019 (RFA)
(21) DE Fox MORGAN ………….. $450,000 ……. 2019 (RFA)(25) DT Michael BROCKERS .. $6,146,000 …… 2017 (UFA)
(25) DT Aaron DONALD ……….. $2,764,500 …… 2018 (Team Option)
(24) DT Dominique EASLEY …….. $600,000 …… 2017 (UFA)
(29) DT Cam THOMAS ……………. $600,000 …… 2017 (UFA)
——————————————————————————————(26) LB Mark BARRON ……….. $6,000,000 ……. 2021 (UFA)
(27) LB Akeem AYERS …………. $3,300,000 ……. 2017 (UFA)
(24) LB Alec OGLETREE ………. $2,236,829 ……. 2018 (UFA)
(24) LB Bryce HAGER …………….. $543,035 ……. 2018 (RFA)
(22) LB Cameron LYNCH ………… $525,666 ……. 2018 (RFA)(22) LB Brandon CHUBB ……….. $450,000 ……. 2019 (RFA)
(24) LB Nic GRIGSBY …………….. $450,000 ……. 2019 (RFA)
(23) LB Cory LITTLETON ………… $450,000 ……. 2019 (RFA)
(22) LB Darreon HERRING ……… $450,000 ……. 2019 (RFA)
——————————————————————————————(26) CB Trumaine JOHNSON .. $13,952,000 ……. 2017 (UFA)
(27) CB Coty SENSABAUGH …… $4,850,000 ……. 2019 (UFA)
(25) CB Lamarcus JOYNER …….. $1,371,867 ……. 2018 (UFA)
(24) CB EJ GAINES …………………… $626,918 ……. 2018 (UFA)
(23) CB Marcus ROBERSON ……… $605,000 ……. 2017 (RFA)(24) CB Troy HILL ……………………. $525,000 ……. 2018 (RFA)
(22) DB Mike JORDAN ………………. $450,000 ……. 2019 (RFA)
(23) CB Jabriel WASHINGTON …… $450,000 ……. 2019 (RFA)
——————————————————————————————(25) SS T.J. MCDONALD ………… $1,833,000 ……. 2017 (UFA)
(27) FS Cody DAVIS ……………….. $1,305,555 ……. 2018 (UFA)
(25) SS Maurice ALEXANDER ……. $716,065 ……. 2018 (UFA)
(24) FS Christian BRYANT …………. $525,000 ……. 2017 (ERFA)(23) FS Brian RANDOLPH ………,,,. $450,000 ……. 2019 (RFA)
(22) FS Jordan LOMAX ……………..,. $450,000 ……. 2019 (RFA)
(23) FS Rohan GAINES ………….,,,,, $450,000 ……. 2019 (RFA)
——————————————————————————————SUMMARY: Rams DEFENSE in 2017 has 11 Players under contract that will become (UFA’s) or (ERFA’s) (Obviously some will not make the 53)
(26) CB Trumaine JOHNSON……. 2017 (UFA)
(25) DT Michael BROCKERS …… 2017 (UFA)
(25) SS T.J. MCDONALD ………… 2017 (UFA)(27) LB Akeem AYERS……………. 2017 (UFA)
(24) DT D. EASLEY ……………….. 2017 (UFA)
(29) DT Cam THOMAS …………… 2017 (UFA)
(28) KK G. ZUERLEIN ……………. 2017 (UFA)(25) DL E. WESTBROOKS ……… 2017 (RFA)
(23) CB M. ROBERSON …………. 2017 (RFA)(24) FS Christian BRYANT ………. 2017 (ERFA)
(24) DE Matt LONGACRE ……….. 2017 (ERFA)SUMMARY: Rams DEFENSE in 2018 has 11 Players under contract that will become (UFA’s) or (RFA’s)
(25) DT Aaron DONALD (Team Option 2018)
(24) LB A. OGLETREE …………… 2018 (UFA)
(24) CB EJ GAINES ………………. 2018 (UFA)
(25) CB L. JOYNER ………………. 2018 (UFA)
(25) SS M. ALEXANDER ……….. 2018 (UFA)(26) DE Quinton COPLES ………. 2018 (UFA)
(28) LS Jake MCQUAIDE ………. 2018 (UFA)
(27) FS Cody DAVIS ……………… 2018 (UFA)(24) LB Bryce HAGER …………… 2018 (RFA)
(22) LB Cameron LYNCH ……….. 2018 (RFA)
(24) CB Troy HILL …………………. 2018 (RFA)http://www.spotrac.com/nfl/los-angeles-rams/cap/
————————————————————————————————————————————VIDEO Link: Demoff & Snead talk about Salary Cap Strategy
Many of you probably have seen plenty of salary cap charts/graphs from sportrac and other sites already so I hope this version and presentation of the Rams current player contracts and salary cap was informal and maybe gave a few of you, a more clear perception of what maybe to expect in the near future.
Thanks for observing, Florida
-
This reply was modified 9 years, 12 months ago by
-
AuthorPosts
- You must be logged in to reply to this topic.
